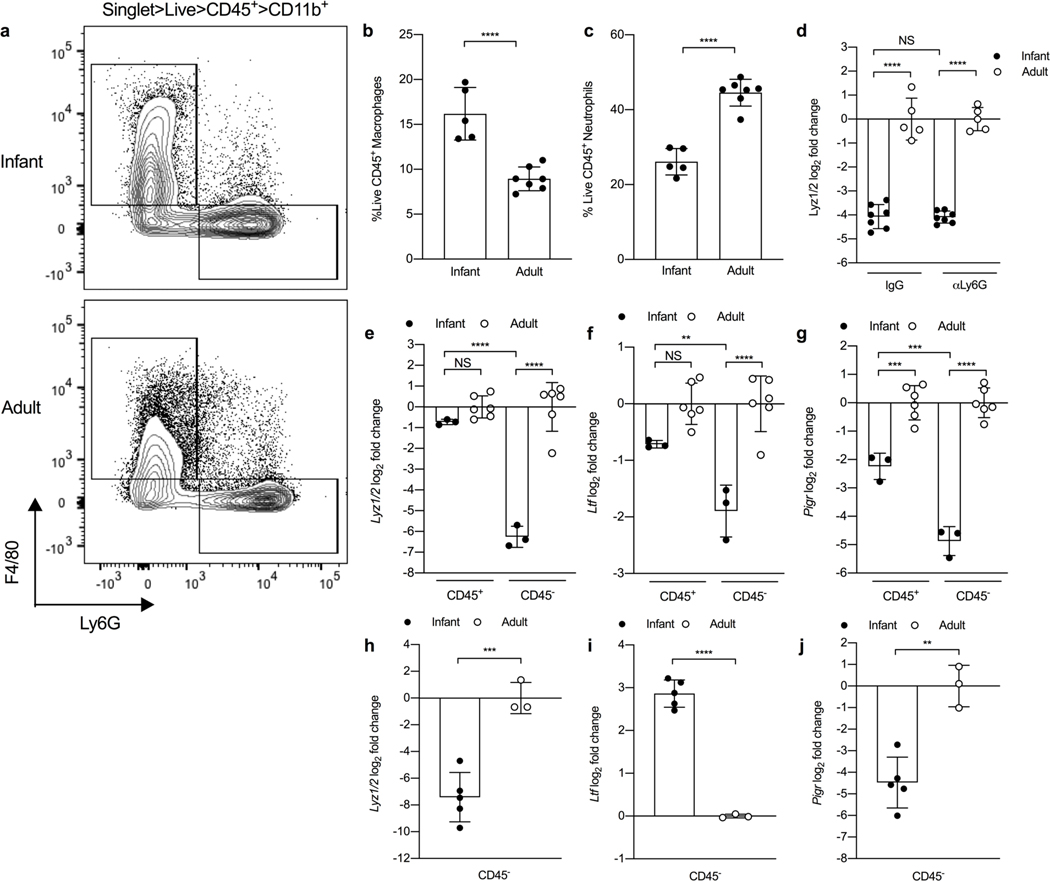
Figure 4. Non-hematopoietic cells are responsible for reduced lysozyme expression during early life.
a, Representative flow plots for frequency of macrophages (singlet live CD45+ CD11b+ F4/80+ Ly6G-) and neutrophils (singlet live CD45+ CD11b+ F4/80- Ly6G+) from uninfected 7 day-old infant and adult mice. b, Percentage of macrophages (singlet live CD45+ CD11b+ F4/80+ Ly6G-) and (c) neutrophils (singlet live CD45+ CD11b+ F4/80- Ly6G+) from naïve 7 day-old infant and adult mice (n=5–7). Data represent mean ± SD. Statistical significance was determined using a unpaired Student’s t test and is indicated as ****, p ≤ 0.0001. Data collected from two independent experiments. d, Transcript levels of Lyz1/2 in nasal lavages from infant and adult mice treated with 2 doses of either a neutrophil depleting antibody (αLy6G) or isotype control (n=5–7). Data represent log2-transformed values with the mean ± SD. Statistical significance was determined using an ordinary one-way ANOVA with a Sidak’s multiple comparisons post-hoc test and is indicated as ****, p ≤ 0.0001. NS, not significant. Data collected from two independent experiments. e-g, Transcript levels of (e) Lyz1/2, (f) Ltf and (g) Pigr in CD45+ and CD45- cells isolated from URT tissue of naïve 7 day-old infant and adult mice (n=3–6). Samples for infant mice were pooled n=3. Data represent log2-transformed values with the mean ± SD. Statistical significance was determined using an ordinary one-way ANOVA with a Sidak’s multiple comparisons post-hoc test and is indicated as **, p ≤ 0.01; ***, p ≤ 0.001; ****, p ≤ 0.0001. Adult data collected from two independent experiments and infant data collected from one experiment using two litters. h-j, Transcript levels of (h) Lys1/2, (i) Ltf and (j) Pigr in CD45- cells isolated from small intestine of naïve 7 day-old infant and adult mice (n=3–5). Samples for infant mice were pooled n=3–4 and samples for adult mice were pooled n=1–2. Data represent log2-transformed values with the mean ± SD. Statistical significance was determined using a unpaired Student’s t test and is indicated as **, p ≤ 0.01; ***, p ≤ 0.001; ****, p ≤ 0.0001. Data collected from two independent experiments.

