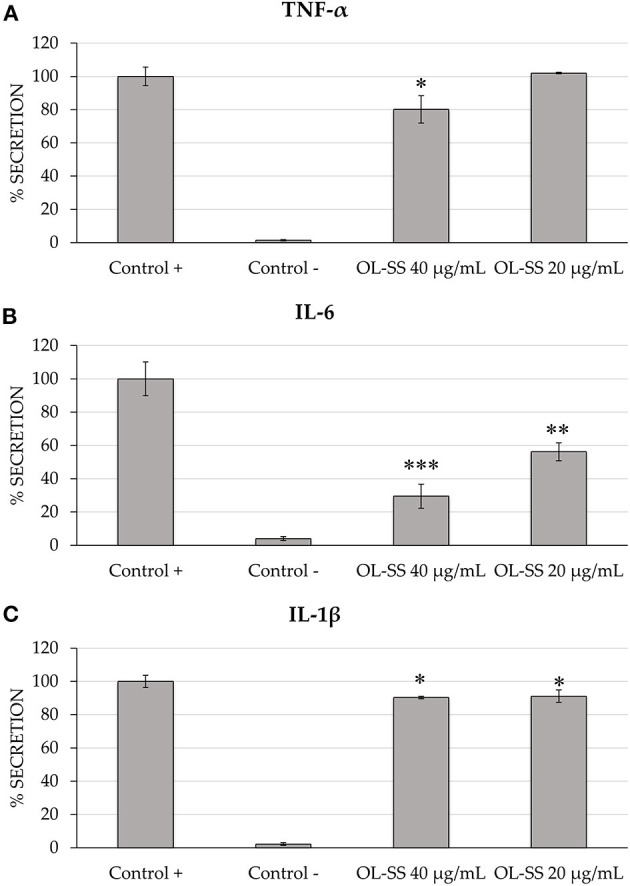
Figure 1.

Secretion levels of TNF-α (A), IL-6 (B), and IL-1β (C) in differentiated THP-1 cells treated with and without LPS treatment (Control + and Control –, respectively), and treated with LPS in the presence of olives leaves-sea sand adsorbate (OL-SS) at 20 and 40 μg/mL. Each bar is the mean of three determinations ± SD. *Denotes statistical differences when compared with positive control (*p < 0.05; **p < 0.01; ***p < 0.001).
