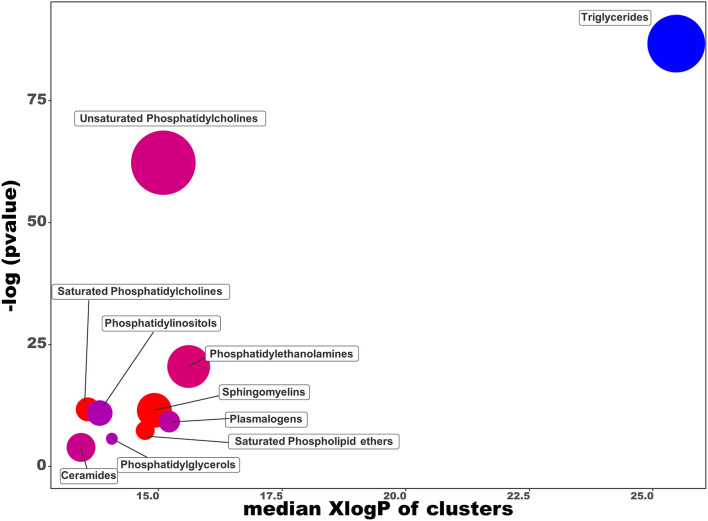
Figure 3.
Chemical similarity enrichment analysis of lipidomics data from SH-SY5Y cells treated with olives leaves-sea sand adsorbate (OL-SS) at 40 μg/mL compared to control conditions for 24 h. The x-axis shows XlogP-values of lipid clusters, y-axis shows the most significantly altered clusters on top. Clusters in red indicate an overall proportion of increased compounds, and blue clusters indicate an overall proportion of decreased compounds. Only enrichment clusters that are significantly different at p < 0.05 are shown.

