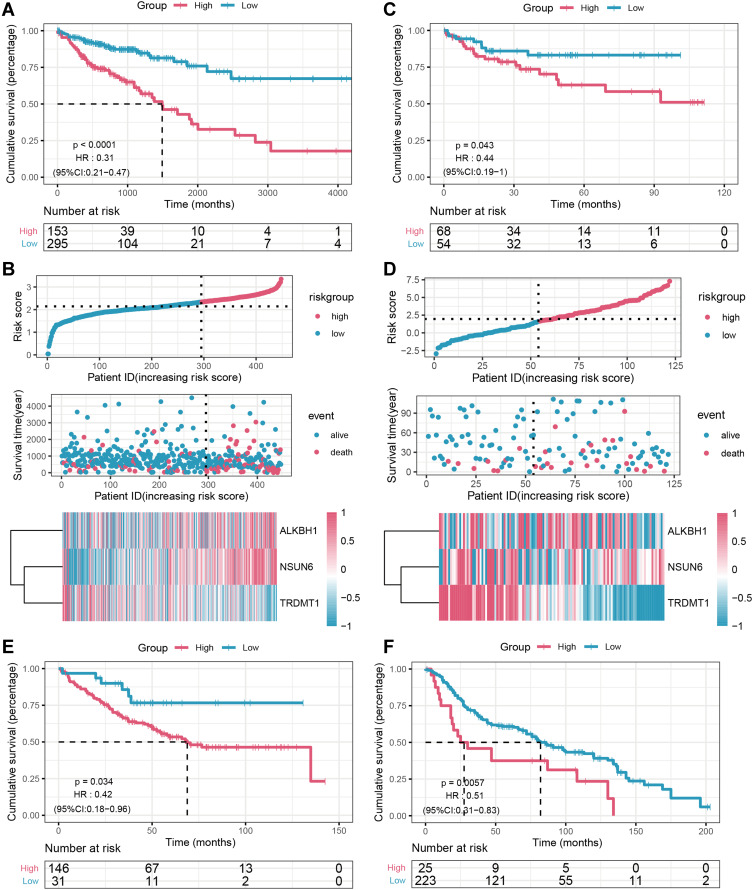
Figure 2.
The prognostic value of the three-m5C signature model from different cohorts. Kaplan–Meier curves for the high and low the risk score patient groups in the GDC_TCGA-COAD cohort (A), GSE38832 (C), GSE17536 (E) and GSE41258 (F). The relationships between the expression of three prognostic genes and the risk score distribution with survival status in the GDC_TCGA-COAD cohort (B), GSE38832 (D) cohorts are shown; the X axis is sorted by the risk scores. Based on the risk score, patients were divided into high-risk and low-risk groups using χ-tile 3.6.1 software.

