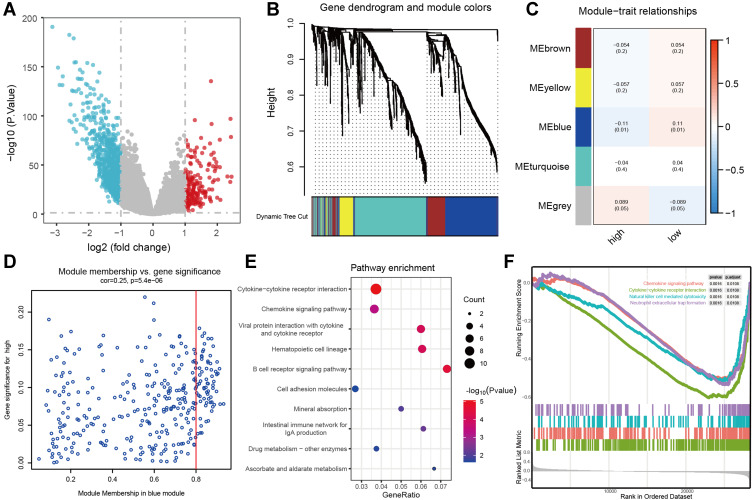
Figure 4.
The biological characteristics of the three-m5C signature. (A) the volcano plot showing the differentially expressed genes between normal tissue and tumor tissue. (B) Gene dendrogram obtained by average linkage hierarchical clustering. The colour row underneath the dendrogram shows the module assignment determined by the Dynamic Tree Cut, in which 5 modules were identified. (C) Heatmap of the correlation between module eigengenes and the m5C modification patterns. (D) A scatterplot of gene significance for low-risk score group vs module membership in the blue module. (E) the KEGG enrichment analysis of genes in the blue module. (F) GSEA results showing significant enrichment of immune-related phenotype in low-risk score group.
Abbreviations: KEGG, Kyoto Encyclopedia of Genes and Genomes; GSEA, gene set enrichment analysis.

