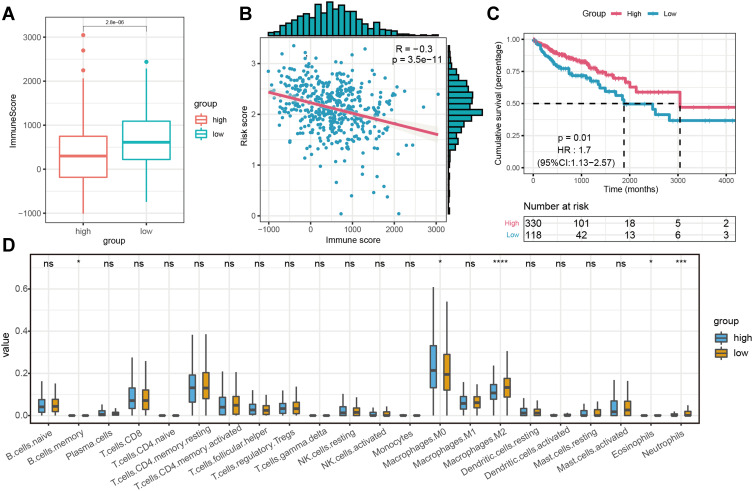
Figure 5.
The Effect on Survival and Immune Infiltration between the high-risk score group and low-risk score group divided by the three-m5C signature in TCGA Cohort. (A) the immunoscore the high-risk score group and low-risk score group; (B) the correlation of immune score and risk score; (C) Kaplan-Meier curves of OS for patients with colon cancer; (D) The infiltrating levels of 22 immune cell types in two groups. (*p < 0.05, ***p < 0.001 and ****p < 0.0001).
Abbreviations: TCGA, The Cancer Genome Atlas; OS, overall survival.

