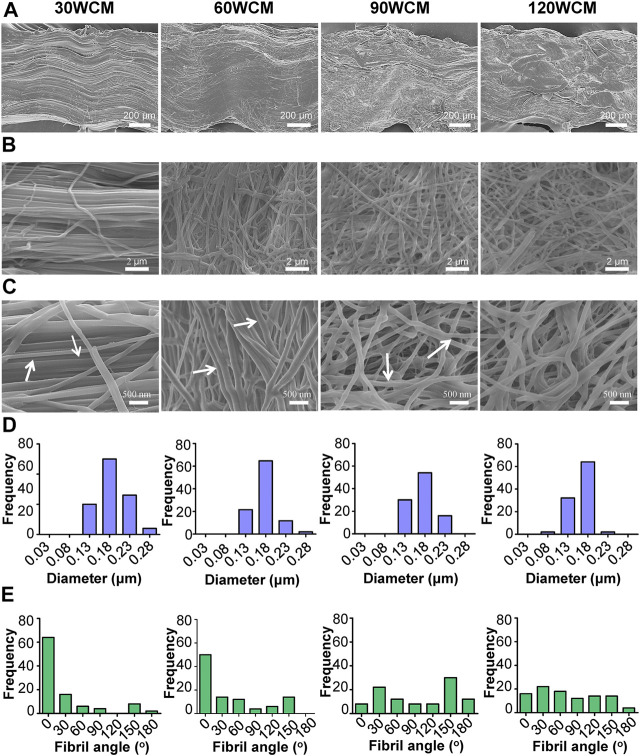
FIGURE 2.
Microstructures of prepared collagen membranes. (A) SEM images of lateral view. (B) Low-magnification SEM images of surface (C) High-magnification SEM images of surface (the arrows represent the cross-band structure of collagen fibrils). Corresponding (D) fibril diameter distributions and (E) fibril orientation distributions of 30, 60, 90, and 120 WCM.

