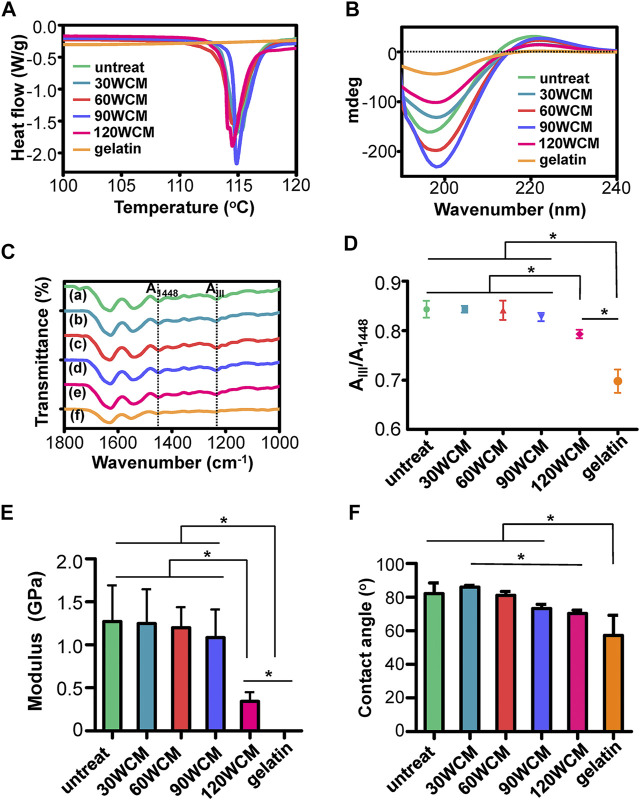
FIGURE 3.
(A) DSC and (B) CD results of prepared collagen membranes. (C) ATR-FTIR spectra, the dotted lines in the ATR-FTIR spectra indicated the peaks at 1,448 cm−1 and amide band III, respectively. (D) Peak ratio of AIII/A1448 (A) untreated collagen membrane, (B–E) 30, 60, 90, and 120 WCM, respectively, and (F) gelatin. (E) Young’s modulus of the prepared collagen membranes. (F) The contact angles of water on prepared collagen membranes. The asterisk on top of the bar indicated a statistically significant difference between groups (p < 0.05).

