
FIGURE 2.
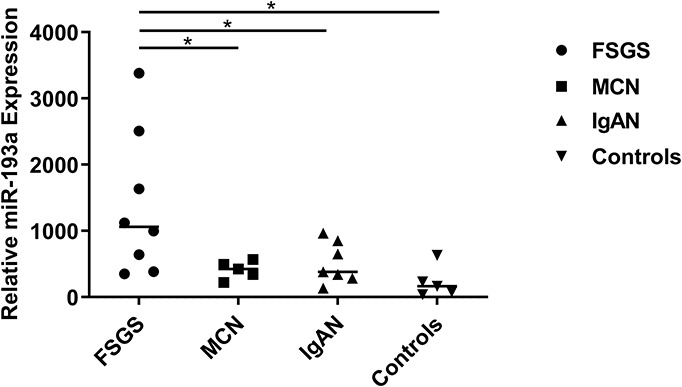
Relative expression levels of urine exosomal miR-193a between patients with FSGS patients and controls. Relative expressions were shown which was calculated with the equation 2–delta Ct, normalized for RNU6 and relative to the control average. Scatter plot (middle line: median). *P < 0.05.