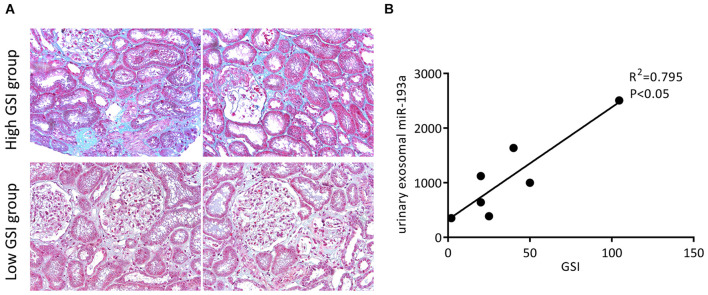
FIGURE 4.
Prognostic values of urine exosomal miR-193a levels in patients with primary FSGS. (A) Representative photomicrographs of the renal biopsy with Masson’s trichrome staining (200×). (B) The correlation between the expression level of urine exosomal miR-193a with GSI in patients with primary FSGS.

