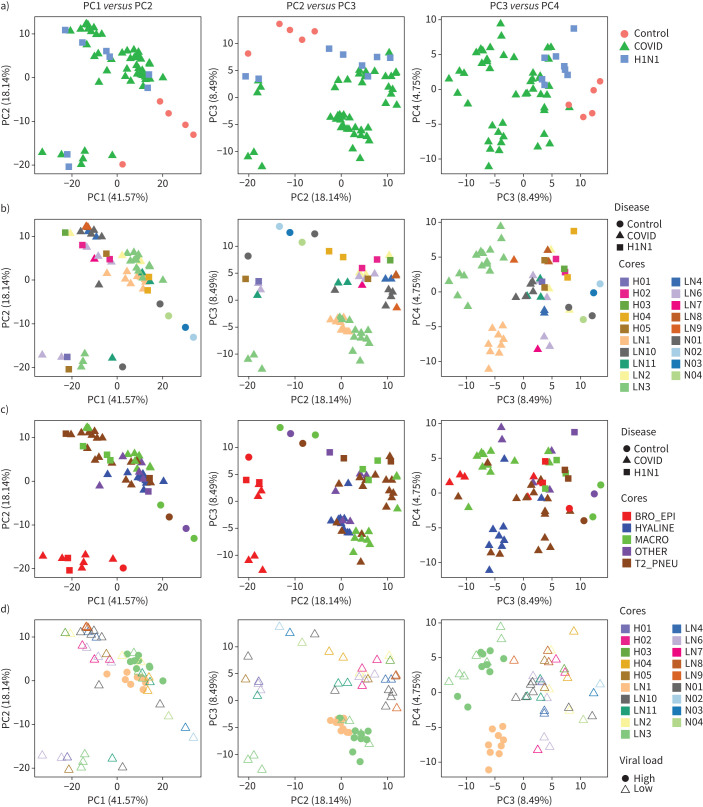
FIGURE 3.
Principal components (PCs) identify variability and factors in the transcriptomic data. PCs capturing orthogonal dimensions of variability in the transcriptomic data in descending order of contribution (i.e. PC1–PC2, PC3–PC2 and PC3–PC4) were plotted stratifying based on the following factors in the experimental data: a) disease types, b) cores/patients with disease types, c) dominant tissue types with disease types and d) viral load in cores/patients. BRO_EPI: bronchiolar epithelium; HYALINE: hyaline membranes; MACRO: macrophages; T2_PNEU: type2 pneumocytes; OTHER: other classifications.

