Figure 3.
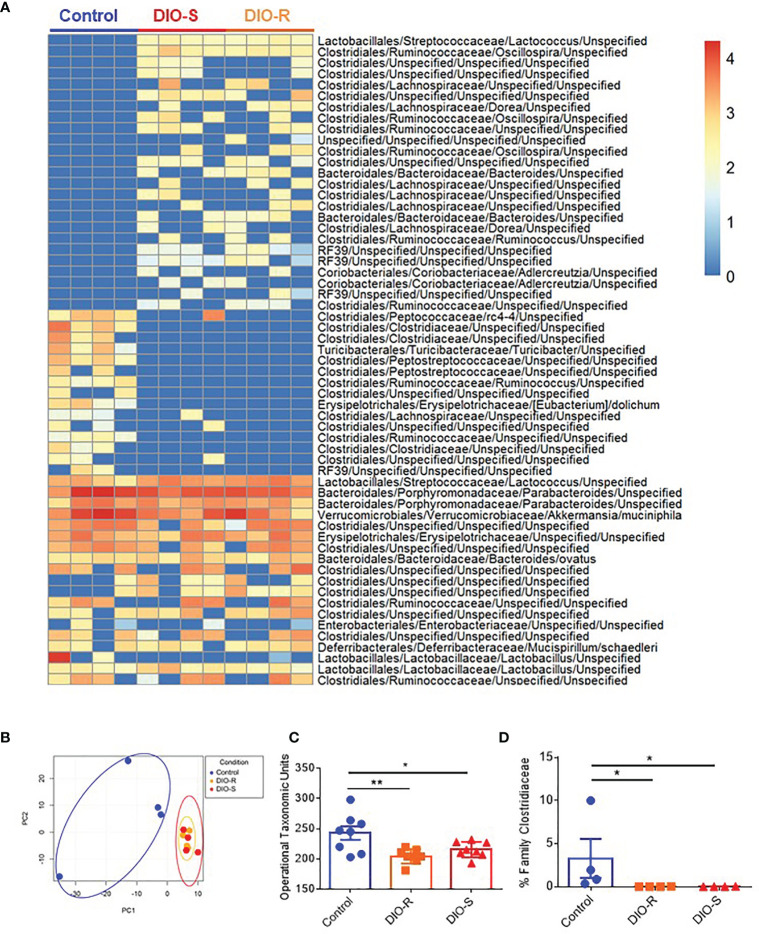
(A) Taxonomic profiles of resting control, DIO-R, and DIO-S BALB/c mice (n=4/group). (B) Principle component analysis (PCA) of microbiome profiles of control, DIO-R, and DIO-S BALB/c mice (n=4/group). (C) Operational taxonomic units (OTUs) in control, DIO-R, and DIO-S BALB/c mice (n=8/group). (D) Abundance of family Clostridiaceae of control, DIO-R, and DIO-S BALB/c mice. Bar graphs depict mean ±s.e.m. One-way ANOVA test was used in (C, D). *p < 0.05, **p < 0.01.

