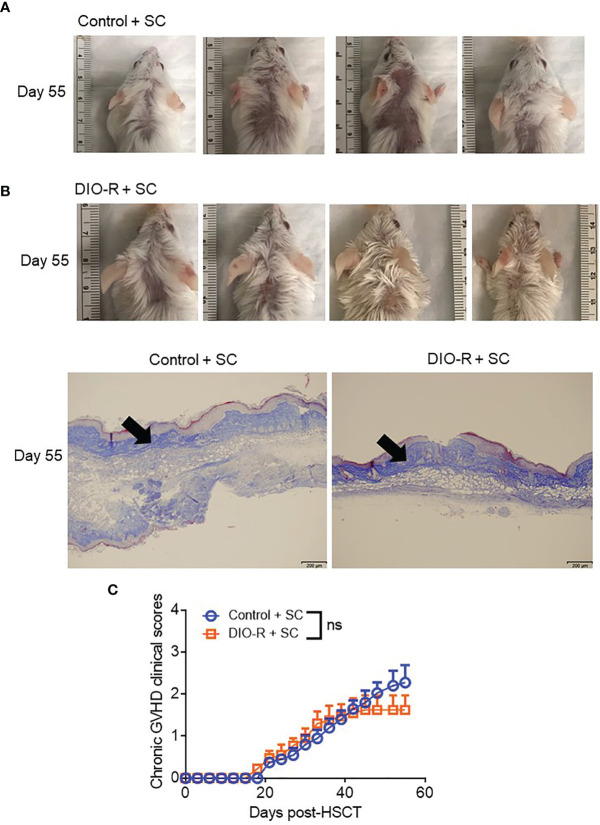
Figure 5.
(A) Representative images of sclerodermatous GVHD with alopecia at day 55 post-HSCT. (B) Representative photos of sclerodermatous GVHD with tissue fibrosis by Trichrome staining. The scale bar is 200μm. Arrows indicate collagen deposition (blue). (C) Chronic GVHD clinical scores post-HSCT (n=4/group). Bar graphs depict mean ±s.e.m. Unpaired Student’s t test was used in (C). NS, not significant.

