
Figure 1.
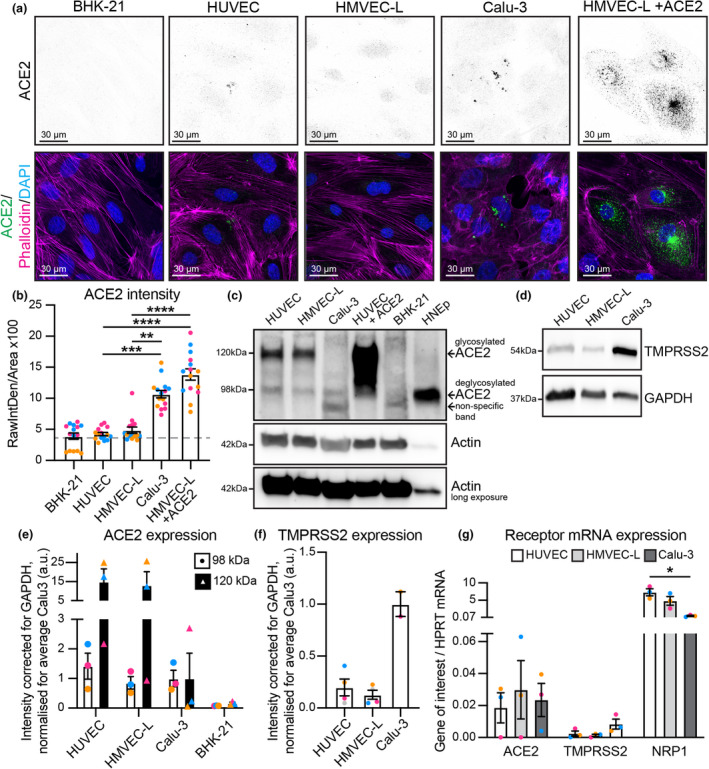
Endothelial cells express low levels of ACE2 and TMPRSS2 receptors. (a) Representative immunofluorescence images of BHK‐21, HUVEC, HMVEC‐L, Calu‐3 and HMVEC‐L + ACE2 overexpression cells stained for ACE2 (shown as single channel in top panel) (green), Phalloidin (magenta) and DAPI (blue). Scale bar 30 µm. (b) Quantification of ACE2 staining intensity, n = 15 images; 5 images per independent experiment, 3 independent experiments. (c) Western blot analysis showing both glycosylated (∼120 kDa) and deglycosylated (∼98 kDa) ACE2 protein. (d) Western blot analysis showing TMPRSS2 protein. (e) Quantification of protein levels for glycosylated ACE2 (∼120 kDa) and deglycosylated ACE2 (∼98 kDa) in HUVEC, HMVEC‐L, Calu‐3 and BHK‐21. n = 3 independent experiments. (f) Quantification of protein levels for TMPRSS2 in HUVEC, HMVEC‐L and Calu‐3. n = 4 (HUVEC and HMVEC‐L), n = 2 (Calu‐3) independent experiments. (g) qPCR shows presence of mRNA for ACE2, TMPRSS2 and NRP1 in HUVEC, HMVEC‐L and Calu‐3 cells. n = 3 independent experiments. Data are presented as mean ± s.e.m. with individual data points indicated and colour coded per independent experimental replicate. Statistical significance was determined using the Kruskal–Wallis test between Calu‐3 and HMVEC‐L +ACE2 and all others (b) or between Calu‐3 and all others (e, f, g). *P < 0.05, ****P < 0.0001.