
Figure 2.
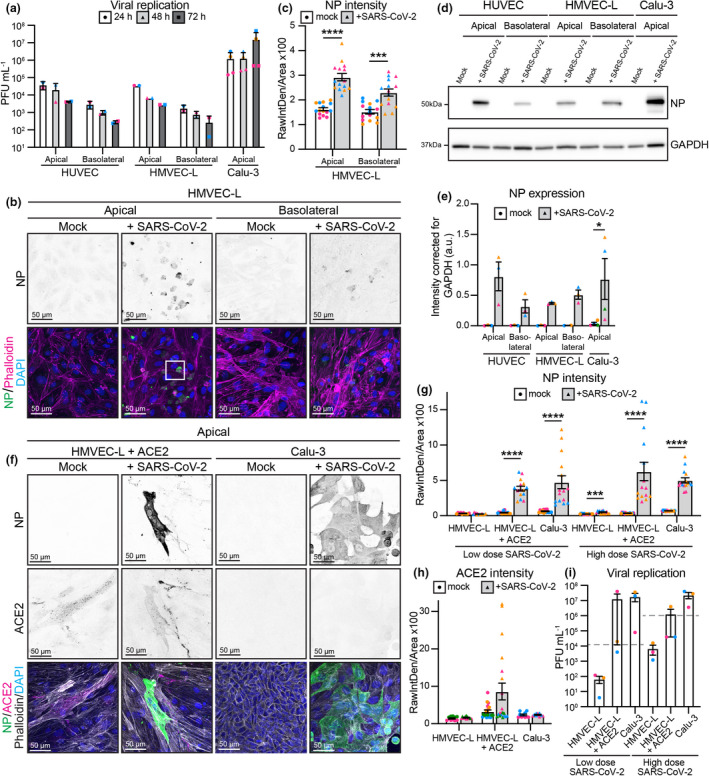
Endothelial cells can be infected with 2 × 10⁶ PFU of SARS‐CoV‐2, but infection is abortive. (a) Viral replication shown as number of PFU mL−1 of supernatant from SARS‐CoV‐2 infected HUVEC, HMVEC‐L and Calu‐3 cells at 24 h, 48 h and 72 h after infection. n = 2 (HUVEC and HMVEC‐L), n = 3 (Calu‐3) independent experiments. (b) Representative immunofluorescent images of HMVEC‐L stained for nucleocapsid protein (NP) (shown as single channel in top panel) (green), Phalloidin (magenta) and DAPI (blue) with mock or SARS‐CoV‐2 infection from either the apical or basolateral side of the cells at 72 h after infection. Scale bar 50 µm. The white box is enlarged in Figure 3. (c) Quantification of NP staining intensity in HMVEC‐L. n = 15 images from 3 independent experiments. (d) Western blot analysis showing NP protein levels in HUVEC, HMVEC‐L and Calu‐3 cells after 72 h of infection. (e) Quantification of NP protein levels in HUVEC, HMVEC‐L and Calu‐3. n = 3 independent experiments. (f) Representative immunofluorescent images of ACE2 overexpressing HMVEC‐L and control Calu‐3 cells stained for NP (shown as single channel in top panel) (green), ACE2 (shown as single channel in middle panel) (magenta), Phalloidin (grey) and DAPI (blue) with mock or SARS‐CoV‐2 infection from the apical side of the cells at 72 h after infection. Scale bar 50 µm. (g) Quantification of NP staining intensity in HMVEC‐L, HMVEC‐L + ACE2 and Calu‐3 with either low (6 × 10⁴) or high (2 × 10⁶) dose of SARS‐CoV‐2 infection. n = 15 images from 3 independent experiments. (h) Quantification of ACE2 staining intensity in HMVEC‐L, HMVEC‐L + ACE2 and Calu‐3. n = 10 (HMVEC‐L and Calu‐3), n = 20 (HMVEC‐L + ACE2) images from 2 independent experiments. (i) Viral replication shown as number of PFU mL−1 of supernatant from SARS‐CoV‐2 infected HMVEC‐L, HMVEC‐L + ACE2 and Calu‐3 cells at 72 h after infection. The grey dashed line indicates input level. n = 3 independent experiments. Data are presented as mean ± s.e.m. with individual data points indicated and colour coded per independent experimental replicate. Statistical significance was determined using the Kruskal–Wallis test between 24 h and other time points (a), between HMVEC‐L and all other conditions (i) or the Mann–Whitney U‐test between mock and + SARS‐CoV‐2 (c, e, g). *P < 0.05, ***P < 0.001, ****P < 0.0001.