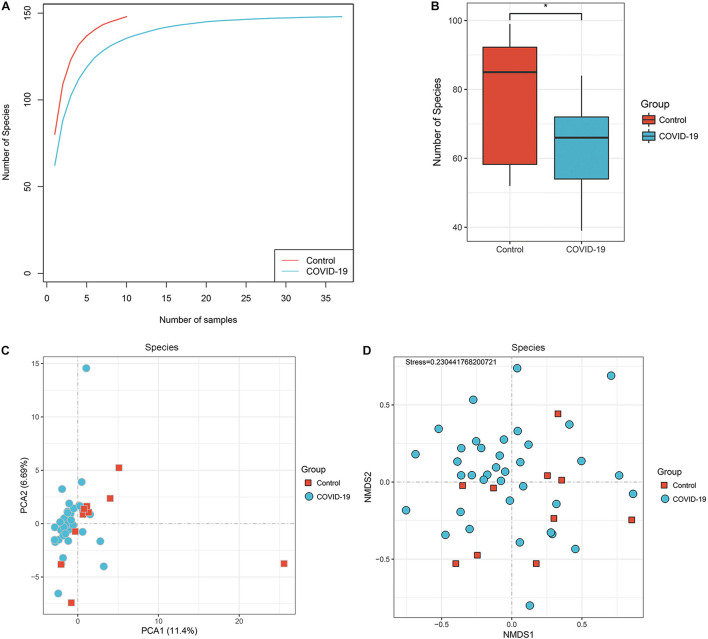
FIGURE 1.
Differences in gut microbial diversity between COVID-19 and healthy controls (HC). (A) The rarefaction analysis between the number of samples and the number of species. As the number of samples increased, the number of species approached saturation in COVID-19 (n = 37) and HC (n = 10). (B) Compared with the HC, the number of species in COVID-19 was decreased significantly. *p < 0.05. (C,D) The principal component analysis (PCA) based on Bray–Curtis distance and the non-metric multidimensional scaling (NMDS) based on species level distribution showed that the gut taxonomic composition differed markedly between individuals in both COVID-19 patients and healthy controls (all p < 0.05; COVID-19).

