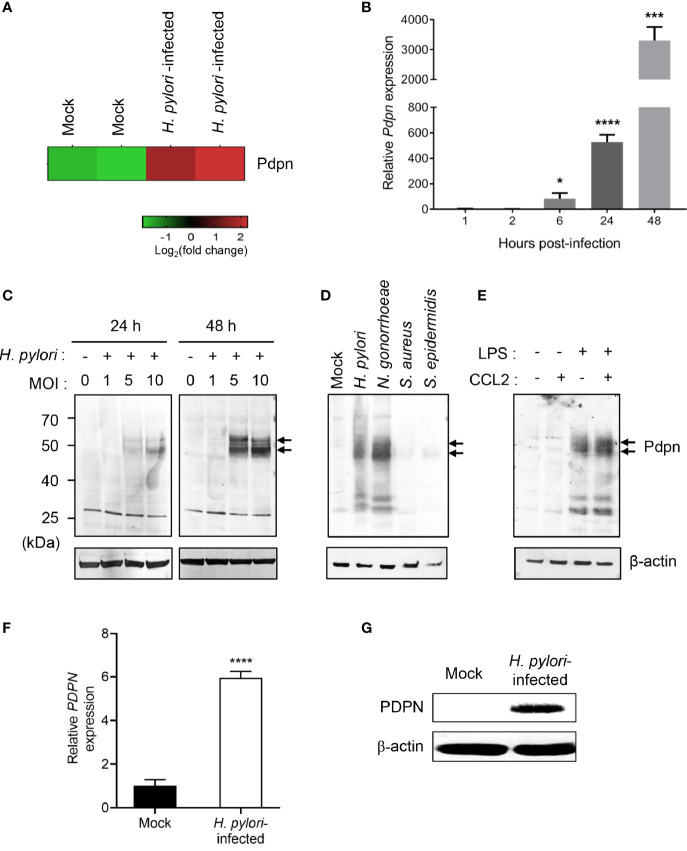
Figure 1.
Upregulation of Pdpn expression in H. pylori-infected macrophages. (A) Microarray heatmap shows Pdpn gene expression in uninfected (mock) or H. pylori (MOI 10, 24 h)-infected RAW264.7 cells. Data were ran with two biological duplicates and were representative of two different probes. (B) Temporal Pdpn mRNA transcript expression of mock or H. pylori (MOI 10)-infected RAW264.7 cells. y-axis shows relative expression of Pdpn to β-actin internal control. Data were shown as mean ± SD, from two experiments ran in triplicate. Statistical significance was analyzed with unpaired Student’s t-test (*p < 0.05, ***p < 0.001, ****p < 0.0001) in comparison to level of uninfected control. (C–E) Immunoblot analyses show Pdpn protein expression in RAW264.7 cells under different stimulation conditions. Pdpn expressions were examined in (C) mock or H. pylori (MOI 1, 5, or 10)-infected cells at 24 or 48 h.p.i.; (D) mock, H. pylori, N. gonorrhoeae, S. aureus, and S. epidermidis (MOI 10, 24 h)-infected cells; and (E) LPS (1 ng/ml)-, CCL2 (100 ng/ml)-, or LPS plus CCL2-stimulated cells. Membranes were probed using anti-Pdpn (upper panel, as indicated by arrows) or anti-β-actin (lower panel) antibodies. Ladder indicates molecular weight, kDa: kiloDalton. Data were representative of at least two independent experiments. (F, G) THP-1 cells were uninfected (mock) or infected with H. pylori J99 strain at MOI 10 for 16 h. (F) PDPN mRNA transcript expression was examined by qRT-PCR method. y-axis shows relative expression of PDPN to β-actin internal control. Data are shown as mean ± SD, from two experiments run in triplicate. Student’s t-test was used for statistical analysis; ****p < 0.0001. (G) Immunoblot analysis shows PDPN protein expression in THP-1 cells in mock or H. pylori (MOI 10 for 16 h)-infected cells. Membranes were probed using anti-PDPN or anti-β-actin antibodies. Data were representative of at least two independent experiments.

