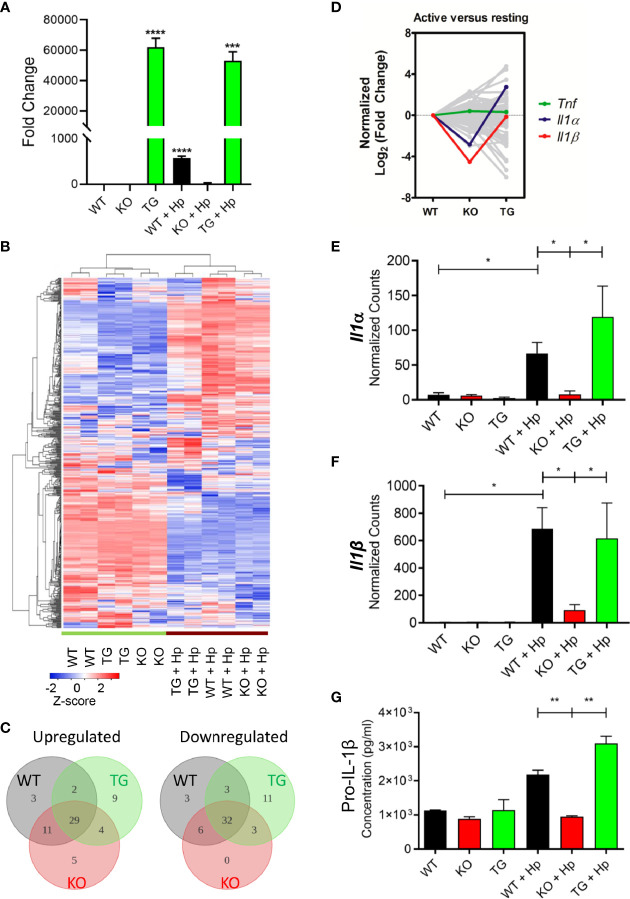
Figure 4.
Pdpn-deletion inhibits the production of IL-1β proinflammatory cytokine. (A) Bar chart depicting the fold changes of Pdpn mRNA transcript expression in the wild type (WT), Pdpn-knockout (KO), and Pdpn-transgenic (TG) cells, before and after H. pylori infection at MOI 10 for 24 h (as indicated by +Hp). The mRNA transcript was isolated from each cell, reverse transcribed to cDNA and subjected to quantitative RT-PCR analysis. y-axis shows normalized fold change of Pdpn over β-actin internal control. Data were shown as mean ± SD of triplicates obtained from representative of two independent experiments. Statistical significance was analyzed with unpaired Student’s t-test (***p < 0.001, ****p < 0.0001). (B) Heatmap showing the gene expression and hierarchical cluster analysis of NanoString data. Color intensity reflects the Z-scores of the RNA abundance. Red represents upregulation while blue represents downregulation. All samples were run as biological duplicates. Statistical analysis was performed by R-based statistic program by either loglinear regression or simplified negative binomial model and adjusted with the Benjamini–Yekutieli method in nCounter Advanced Analysis 2.0 software. (C) Venn diagrams show the number of differentially upregulated (log2 fold change > 2, left panel) or downregulated (log2 fold change < -2, right panel) genes following H. pylori infection. Subsets are WT (gray), KO (red), and TG (green). Overlap region indicated the number of common differentially expressed genes among comparison groups. Diagram was generated by Lucidchart platform. (D) Line chart showing the normalized trend of differentially expressed genes following infection. y-axis represents the normalized log2 fold change of each gene in WT, KO, or TG samples over the log2 fold change of WT. Sharp “V” trendline was observed for Il1α and Il1β in KO cells, indicating drastically lower increment following infection when compared to both WT and TG cells. Differential expressions were computed in the nSolver Advance Analysis Software 2.0. (E, F) Bar charts show normalized RNA transcript counts of (E) Il1α and (F) l1β from NanoString analysis. Data are shown as mean ± SD of duplicate samples. Statistical significance was analyzed with unpaired Student’s t-test (*p ≤ 0.05). (G) Bar chart shows ELISA analysis of pro-IL-1β production in cell lysate. y-axis represents cytokine concentrations in pg/ml. Data were shown as mean ± SD of duplicates obtained from representative of two independent experiments. Statistical significance by unpaired Student’s t-test (**p < 0.01).

