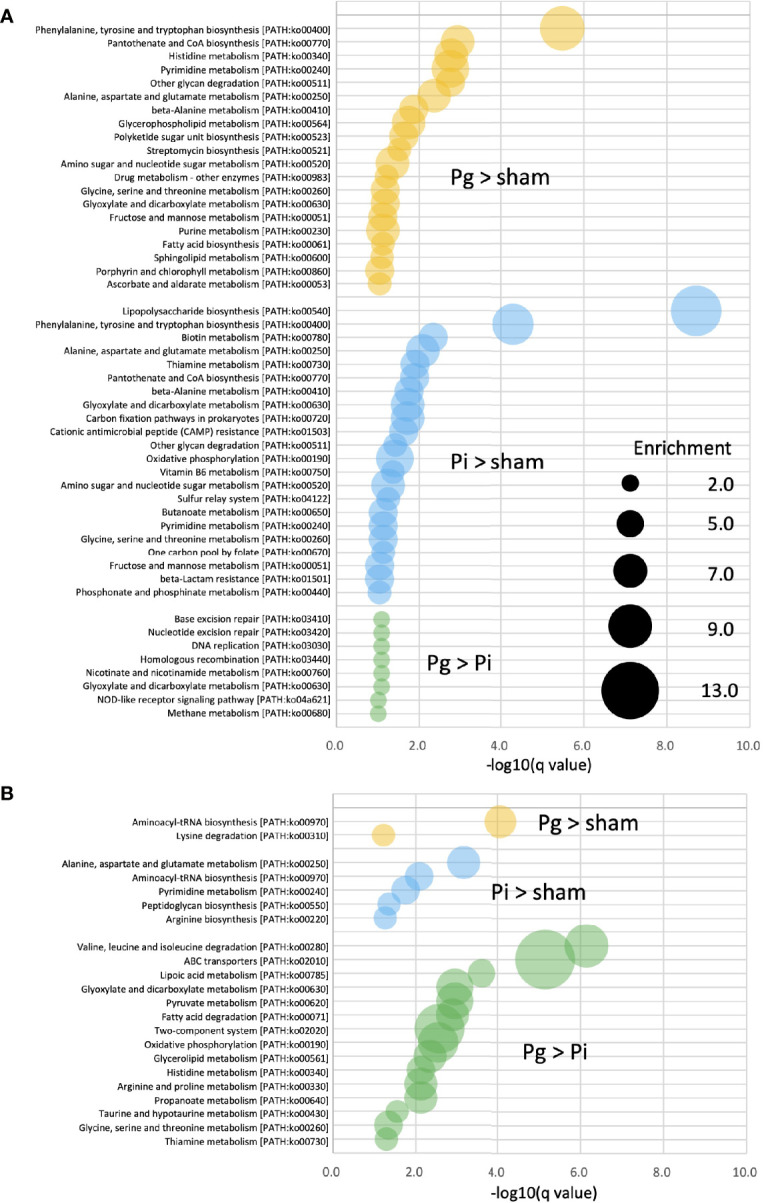
Figure 6.

KEGG biomarkers from the metagenomic analysis of gut microbiota. Pathway analysis of differentially enriched genes between two groups. Enriched KEGG pathways (q < 0.1) at TP2 (A) and TP3 (B) are shown. The bubble size indicates the number of KOs enriched in each pathway. Expressions containing inequality signs (e.g., “Pg > Sham”) indicate that the results of enrichment analysis with Kos, in which the abundant of KOs for the left category (Pg mice) are significantly more abundant than those in the right category (Sham mice).
