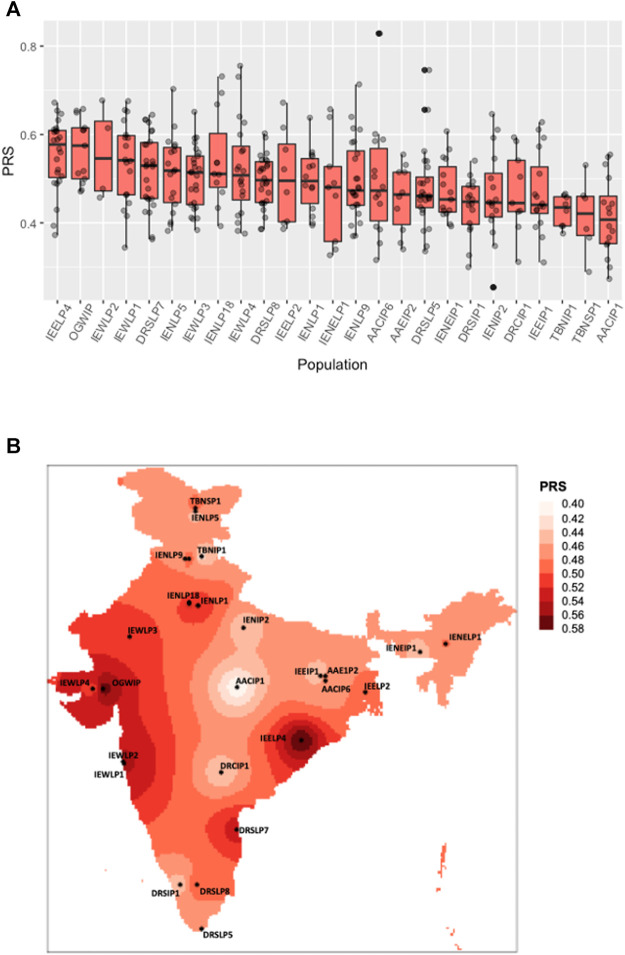
FIGURE 1.
Distribution of polygenic risk scores across Indian sub-populations. (A) The boxplot shows a polygenic risk score distribution across 25 Indian sub-populations from the IGVC divided on the basis of linguistic and geographical regions (IP, tribal populations; LP, caste; and SP, religious groups). (B) Spatial distribution of PRSs calculated for IGVC populations spanning different districts of India.

