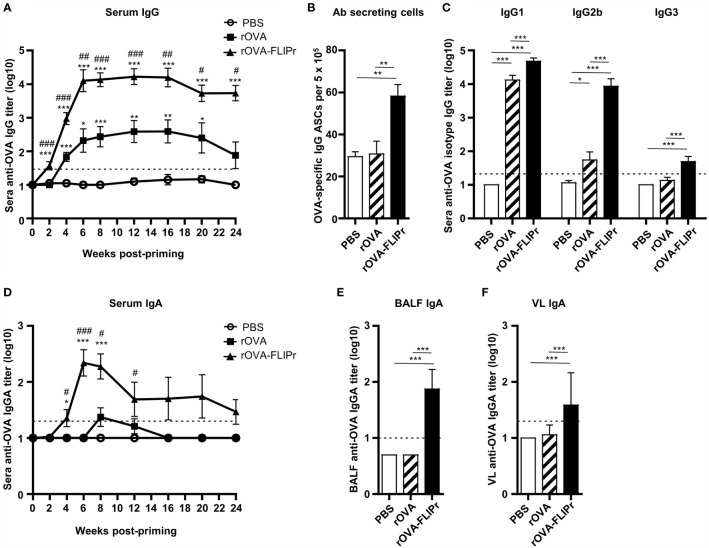
Figure 3.
Antibody responses induced by intranasal administration of rOVA-FLIPr. Groups of C57BL/6 mice (n=6/group) were intranasally immunized three times with 30 μg of OVA or OVA-FLIPr in PBS at 2-week intervals. Mice immunized with PBS alone (without antigens) served as controls. Sera were collected at the indicated time points. (A, D) OVA-specific IgG and IgA was assessed by ELISA. Data represent the mean ± SE of the mean. Statistical significance was determined using the Kruskal-Wallis test with Dunn’s multiple comparison test. *p < 0.05; **p < 0.01; ***p < 0.001 v.s. PBS. #p < 0.05; ##p < 0.01; ###p < 0.001 v.s. rOVA. (B) OVA-specific antibody-secreting cells in splenocytes were evaluated using ELISPOT at 24 weeks after the first vaccination. (C) Reactivity of subtype IgG1, IgG2b, and IgG3 antibodies specific to OVA. (E, F) Reactivity of OVA-specific IgA antibody titers in BALF and VL was assessed by ELISA. The BALF and VL were collected 6 weeks after the first vaccination. Data represent the mean ± SE of the mean. The detection limit is indicated by the dotted line on the y-axis, which indicates the initial dilution factor of the sample. Statistical significance was determined using the Kruskal-Wallis test with Dunn’s multiple comparison test. *p < 0.05; **p < 0.01; ***p < 0.001. The results are representative of three independent experiments.

