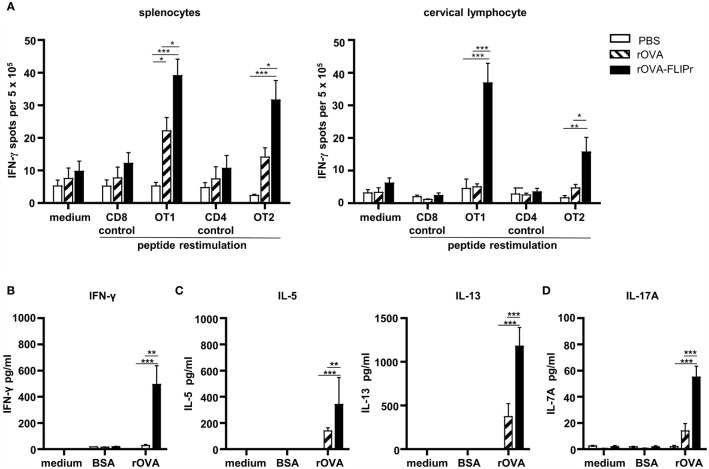
Figure 4.
T cell responses and cytokine production profiles induced by intranasal administration of rOVA-FLIPr. Groups of C57BL/6 mice (n=5/group) were immunized three times intranasally with 30 μg of OVA or OVA-FLIPr in PBS at 2-week intervals. Mice immunized with PBS alone (without antigens) served as controls. (A) Splenocytes and cervical lymphocytes were harvested one week after the last immunization. Cells were cultured and stimulated with OT1, OT2, or control peptides for 3 days in an anti-INF-γ-coated 96-well ELISPOT plate. IFN-γ responses were measured using ELISPOT assay and are expressed as spot-forming units per 5×10⁵ cells. (B–D) Splenocytes were cultured and stimulated with rOVA for 4 days. Stimulation with BSA or medium alone served as controls. The supernatants were collected to evaluate levels of (B) IFN-γ, (C) IL-5, IL-13 and (D) IL-17A by ELISA. Data represent the mean ± SE of the mean. The results shown are from one of two representative experiments. Statistical significance was determined using the Kruskal-Wallis test with Dunn’s multiple comparison test. *p < 0.05; **p < 0.01; *** p < 0.001.

