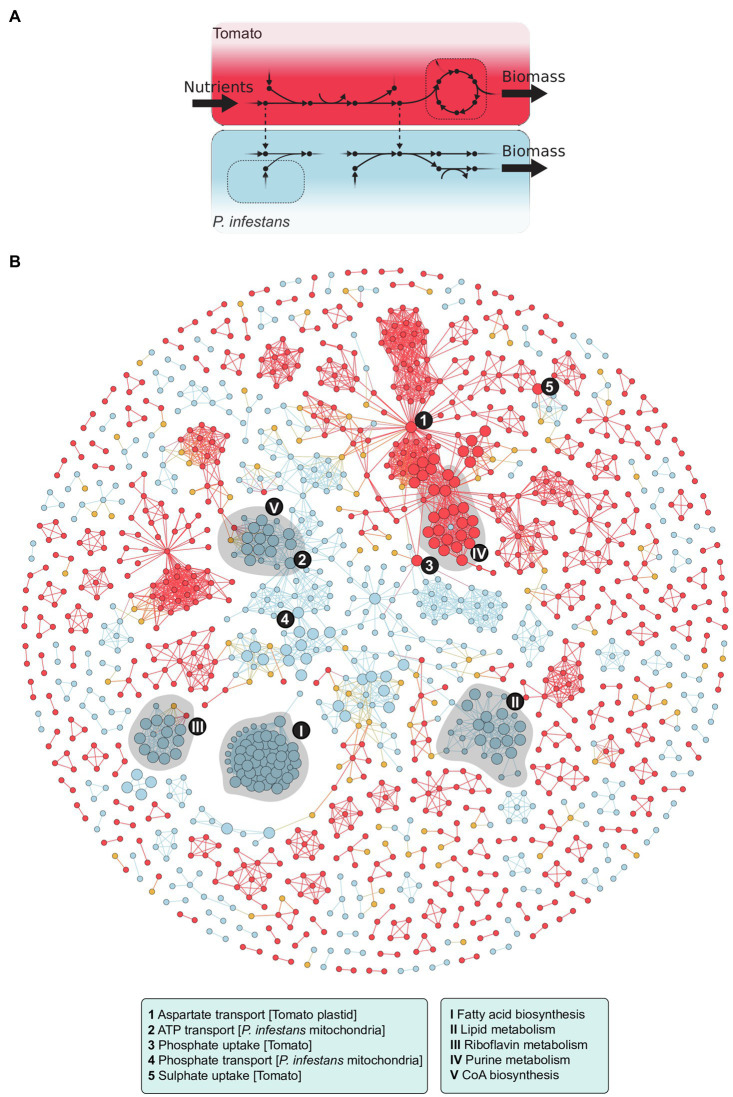
Figure 2.
The integrated P. infestans–tomato model (reproduced and adapted from Rodenburg et al., 2019). (A) Diagram in which dots represent metabolites, arrows reactions, and dotted lines host–pathogen transport reactions. (B) Flux coupling analyses of the model identified 77 coupled (i.e., topographically related) P. infestans–tomato reaction pairs which are shown in the graph. Nodes represent reactions in tomato (red) or P. infestans (blue) and host–pathogen transport (yellow). Edges represent coupling between those reactions. The nodes with the largest diameter represent 112 reactions in P. infestans and 35 in tomato that were found to be essential for P. infestans biomass production. The various processes listed in the boxes are represented by highly connected nodes (1 to 5) and in shaded clusters (I to V). Further details in Rodenburg et al. (2019).

