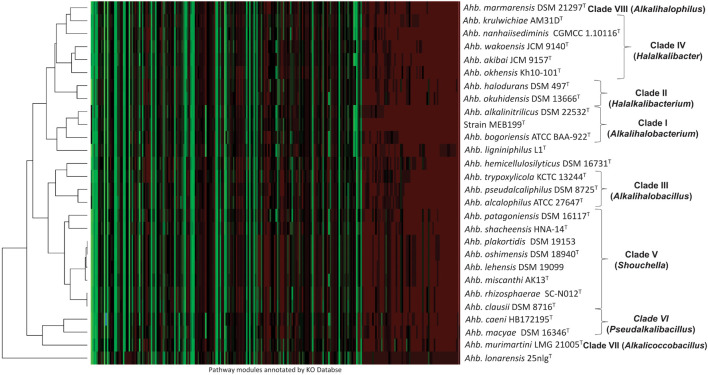
FIGURE 4.
Heatmap showing functional potential of all the members of the genus Alkalihalobacillus. Functional annotations were performed using EggNOG, and pathways were reconstructed using the KEGG Orthology (KO) Database server, and heatmap was generated by the Heatmapper using average linkage clustering method and Spearman rank correlation distance measurement method. The color variations depict the relative abundance of genes in the pathways wherein red denotes the maximally abundant pathways, and green represents the least abundant pathways.

