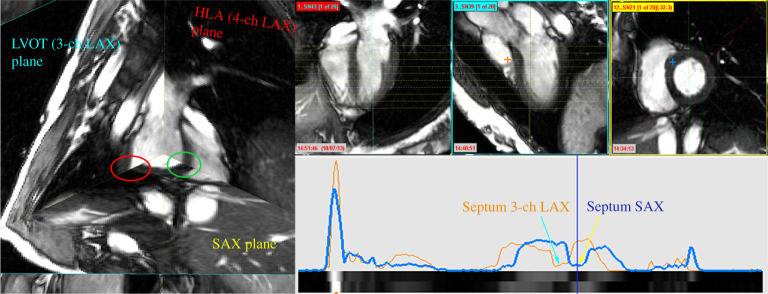
Figure 3.
Left: Cine MR slices in their 3D spatial positions. Here, a good alignment exists between HLA and SAX (in green ellipse); but a clear misalignment is visible between LVOT and SAX (in red ellipse). Right: At the top, the same three HLA, LVOT and SAX slices, and at the bottom, the intensity profiles of LVOT (in orange) and SAX (in blue) along their intersection line, where a misalignment at the septum is visible. The blue vertical line along the profile corresponds to the location along the intersection line (denoted by ‘+’) on the 2D slices above. (Online version in colour.)

