Fig. 3.
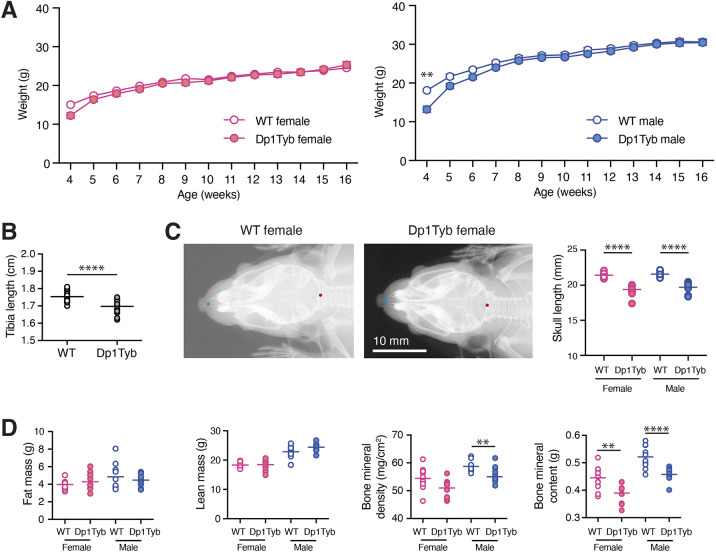
Skeletal changes and decreased bone mineral density and content in Dp1Tyb mice. (A) Mean±s.e.m. weight of Dp1Tyb and WT mice (cohort 1) as a function of age. (B) Tibia length of WT and Dp1Tyb mice (cohort 1), showing combined data from females and males, determined from X-ray images. (C) Example X-ray images of dorsal views of WT and Dp1Tyb female mouse skulls (cohort 1). Graph shows the length of the skull from the anterior tip of the nasal bone to the posterior of the occipital bone, which are indicated as blue and red dots on the images, respectively, from WT and Dp1Tyb mice (cohort 1). (D) Fat mass, lean mass, bone mineral density and bone mineral content of Dp1Tyb and WT mice (cohort 1) determined by DEXA. Horizontal lines indicate mean. Here and in other figures in which the sexes are analysed separately, the graphs are coloured pink and blue for females and males, respectively. Where both sexes are analysed together, graphs use white (WT) and grey (Dp1Tyb) to distinguish the genotypes. **0.001<q<0.01; ****q<0.0001.

