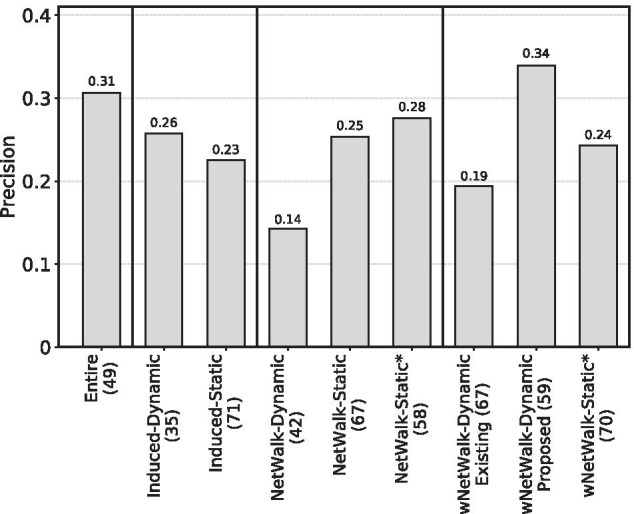
Fig. 4.

Cancer-related validation of the novel aging-related gene predictions for the eight considered (sub)networks, each under its best predictive model, when using the primary GenAge-based definition of aging- and non-aging-related gene labels, and when using HPRD. On the x-axis, the number in the parentheses after the name of each (sub)network is the number of the novel predictions. The precision score of a (sub)network is the percentage of novel predictions that are validated by the cancer-related data. Note again that we have two groups of results for wNetWalk-Dynamic, i.e., wNetWalk-Dynamic Existing and wNetWalk-Dynamic Proposed, which we already explained in the caption of Fig. 2. For results when using BioGRID instead of HPRD, see Additional file 1: Fig. S7
