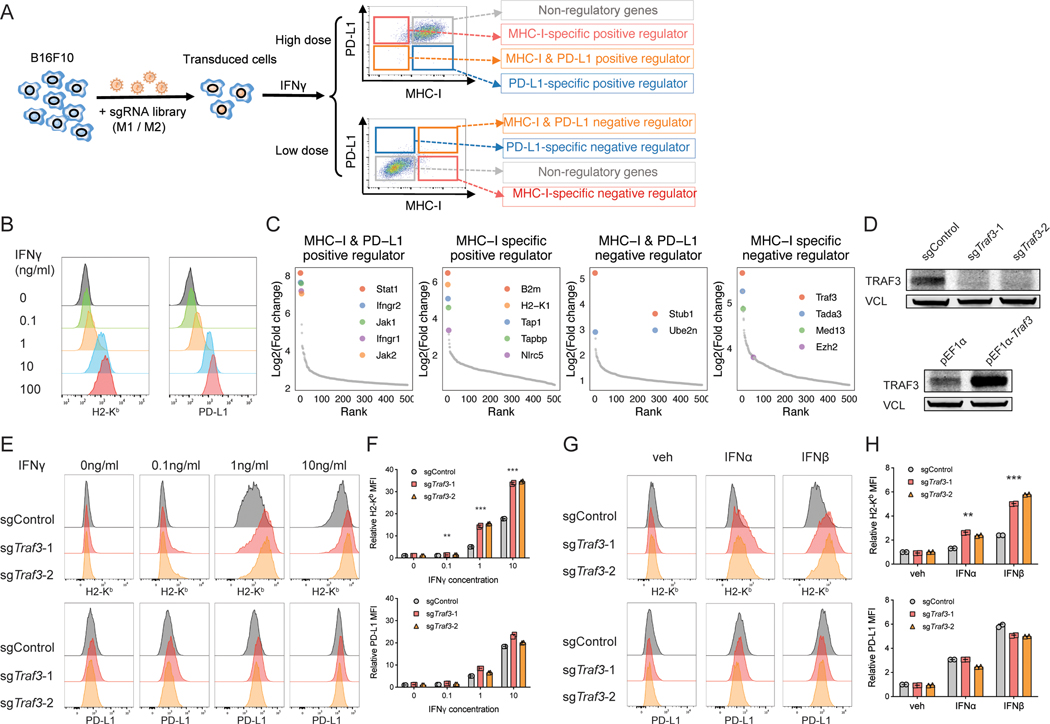
Figure 1. CRISPR screens identify novel regulators of MHC-I.
(A) Workflow of using CRISPR screens to identify the positive or negative regulators of MHC-I and/or PD-L1. We transduced B16F10 mouse melanoma cells with an in-house-designed genome-wide sgRNA library, expanded the transduced cells, and stimulated the cells with 0.1ng/ml (low dose) or 10ng/ml IFNg (high dose) for different levels of MHC-I/PD-L1 induction. We then performed FACS to isolate the MHC-IhiPD-L1hi, MHC-IhiPD-L1lo, MHC-IloPD-L1hi, and MHC-IloPD-L1lo sub-populations. We amplified and sequenced the gRNAs in these sub-populations as well as the bulk pre-sorting population to identify genes that were enriched in each sorted sub-population. MHC-I and/or PD-L1 regulators are expected to be enriched in the sub-populations as indicated. (B) Titration of IFNγ concentration to test its effect on MHC-I and PD-L1 expression. Histogram of H2-Kb and PD-L1 levels assessed by flow cytometry following two-day treatment with different concentrations of IFNγ. (C) CRISPR screen reveals known and novel candidate regulators of MHC-I and/or PD-L1. Ranked dot plots of gene enrichment in each sorted sub-population compared to the unsorted population are shown. The X axis shows the rank of each gene, and the Y axis shows the log2 enrichment of sgRNAs for each gene in the indicated sub-population compared to the unsorted population. (D) Immunoblot of B16F10 cells with indicated genotypes shows good efficiency of Traf3 knockout or overexpression. (E-F) Validation of TRAF3 as a negative regulator of MHC-I with IFNγ induction. B16F10 cells transduced with control sgRNA or sgTraf3 were cultured for 48 hours, with IFNγ concentrations as indicated, and then assessed on their MHC-I and PD-L1 levels. (E) Typical histogram of H2-Kb and PD-L1 FACS plot of control or Traf3-deficient B16F10 cells in each treatment condition. (F) Quantification of median fluorescence intensity (MFI) of H2-Kb or PD-L1 from (E). Values are normalized to the sgControl group with vehicle treatment. (**P < 0.01, ***P < 0.001; Two-way ANOVA with Benjamini-Hochberg post test comparing sgTraf3 and sgControl in each condition). (G-H) Validation of TRAF3 as a negative regulator of MHC-I with type-I IFN induction. B16F10 cells transduced with control sgRNA or sgTraf3 were cultured for 48 hours with treatment as indicated, and then assessed on their MHC-I and PD-L1 levels. 500U/ml IFNα or IFNβ was used. (G) Typical histogram of H2-Kb and PD-L1 FACS plot of control or Traf3-deficient B16F10 cells in each treatment condition. (H) Quantification of MFI of H2-Kb or PD-L1 from (G). Values are normalized to the sgControl group with vehicle treatment. (**P < 0.01, ***P < 0.001; Two-way ANOVA with Benjamini-Hochberg post test comparing sgTraf3 and sgControl in each condition).

