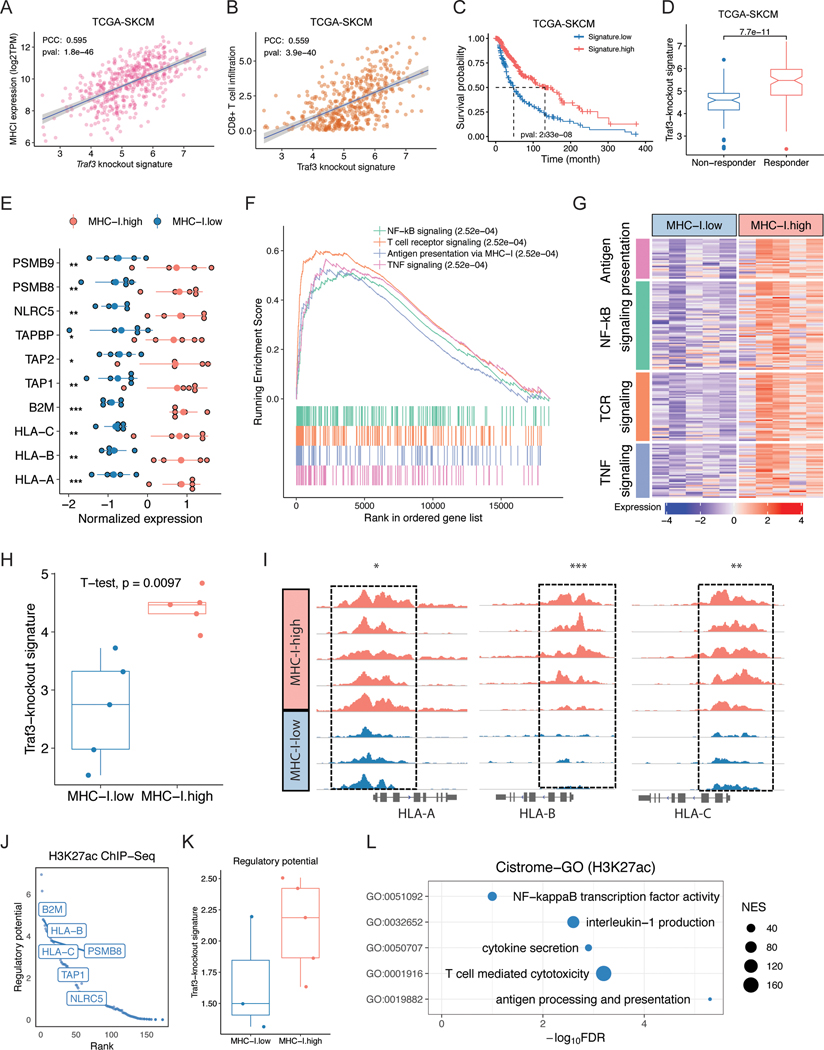
Figure 4. Traf3-knockout signature is correlated with higher MHC-I in primary patient samples.
(A-C) Traf3 knockout signature is positively correlated with (A) MHC-I expression, (B) CD8+ T cell infiltration, and (C) patient survival in the TCGA SKCM dataset. PCC: Pearson correlation coefficient. (D) TIDE-predicted ICB responders showed higher Traf3-knockout signature values in the TCGA SKCM dataset. (E) Expression of MHC-I component or related genes in MHC-I-high or -low samples. (F) GSEA of differentially expressed genes in MHC-I-high versus MHC-I-low samples. (G) MHC-I-high samples show higher expression of genes involved in antigen presentation, NF-κB signaling, TNF signaling, and Toll-like receptor pathways. (H) Traf3-knockout signature score in MHC-I-high or MHC-I-low RNA-seq samples. (I) H3K27ac ChIP-seq results for the HLA-A/B/C loci in MHC-I-high or MHC-I-low samples. (J) Top 200 genes with the higher regulatory potential value in MHC-I-high versus MHC-I-low H3K27ac ChIP-seq samples. (K) Traf3-knockout signature score of H3-K27ac ChIP-seq regulatory potential values in MHC-I-high or -low samples. (L) Cistrome-GO enrichment analysis of H3K27ac ChIP-seq peaks with stronger signal in MHC-I-high compared to MHC-I-low samples.

