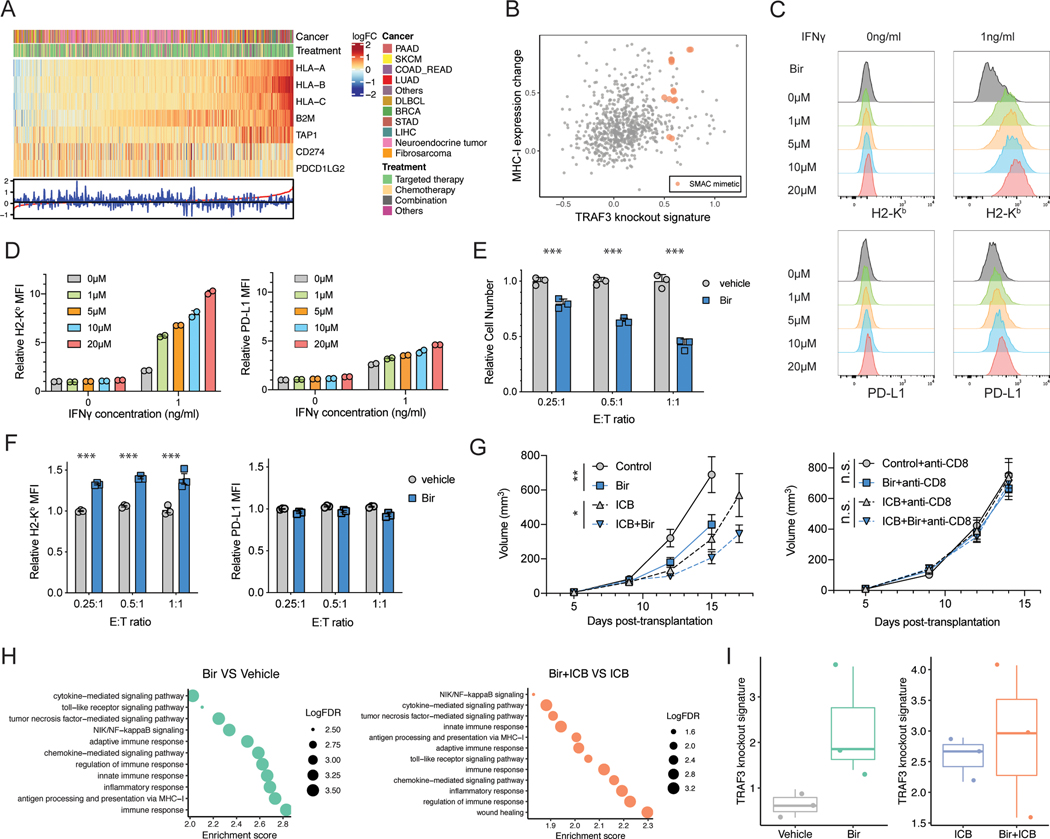
Figure 6. Birinapant can specifically upregulate MHC-I and add to the efficacy of ICB treatment.
(A) Heatmap of the regulation of transcription of MHC-I components and PD-L1/PD-L2 in each drug treatment condition. Data are ordered by the magnitude of MHC-I regulation from the most upregulated (left) to the most downregulated (right). (B) Characterization of each drug treatment for effect on MHC-I expression and Traf3-knockout signature value. (C) Flow cytometry of B16F10 cells treated by IFNg and/or different concentrations of the SMAC mimetic birinapant (Bir). Typical histograms of H2-Kb and PD-L1 levels in each condition are shown. (D) The relative MFI of samples in (C). Mean ± s.d. is shown for each group. Values are normalized to the mean MFI at 0ng/ml IFNγ 0μM birinapant. (E) Relative B16F10 cell number after co-culture with OT-I T cells at different E:T ratios revealed a higher sensitivity of B16F10 cells to T-cell-mediated cytotoxicity under birinapant treatment. The bar plots present the relative cell number in each group, normalized to the cell number in the vehicle treatment group in each E:T condition. Mean ± s.d. and individual replicate values are shown for each group. (***P < 0.001; Two-way ANOVA with Benjamini-Hochberg post test). (F) Relative MFI of H2-Kb or PD-L1 of B16F10 cells co-cultured with OT-I T cells. Values are normalized to the vehicle treatment group in E:T = 0.25 condition. Mean ± s.d. and individual replicate values are shown for each group. (***P < 0.001; Two-way ANOVA with Benjamini-Hochberg post test comparing vehicle and SMAC treatment groups in each condition). (G) Longitudinal tumor size of tumors under different treatments. Mean ± s.e.m. is shown for each group at each time point. (**P < 0.01, ***P < 0.001; Two-way ANOVA with Benjamini-Hochberg post test). (H) GSEA of the bulk tumor RNA-seq data evaluating the gene sets that were upregulated in response to SMAC mimetic. (I) Quantification of Traf3 knockout signature in each treatment group revealed a trend toward upregulation in response to birinapant treatment.

