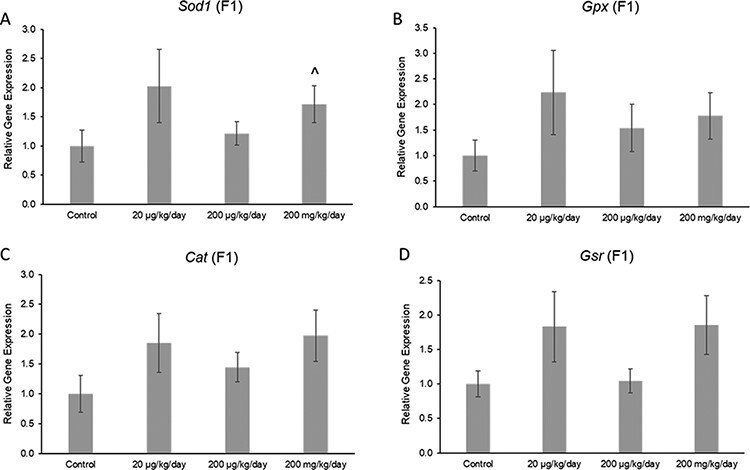
Figure 7:

Effects of prenatal exposure to the phthalate mixture on the antioxidant enzymes Sod1 (panel A: control = 5 females/treatment group, 20 µg/kg/day = 5 females/treatment group, 200 µg/kg/day = 4 females/treatment group, 200 mg/kg/day = 5 females/treatment group), Gpx (panel B: control = 5 females/treatment group, 20 µg/kg/day = 5 females/treatment group, 200 µg/kg/day = 4 females/treatment group, 200 mg/kg/day = 5 females/treatment group), Cat (panel C: control = 5 females/treatment group, 20 µg/kg/day = 5 females/treatment group, 200 µg/kg/day = 4 females/treatment group, 200 mg/kg/day = 5 females/treatment group), and Gsr (panel D: control = 5 females/treatment group, 20 µg/kg/day = 5 females/treatment group, 200 µg/kg/day = 4 females/treatment group, 200 mg/kg/day = 5 females/treatment group) in ovaries from mice at 13 months of age in the F1 generation. All gene expression is relative to the housekeeping gene, Actb, and the relative fold change is normalized to 1 for control. Graphs represent means ± SEM. Carets (^) indicate borderline significance compared to the control (0.05 < P < 0.1)
