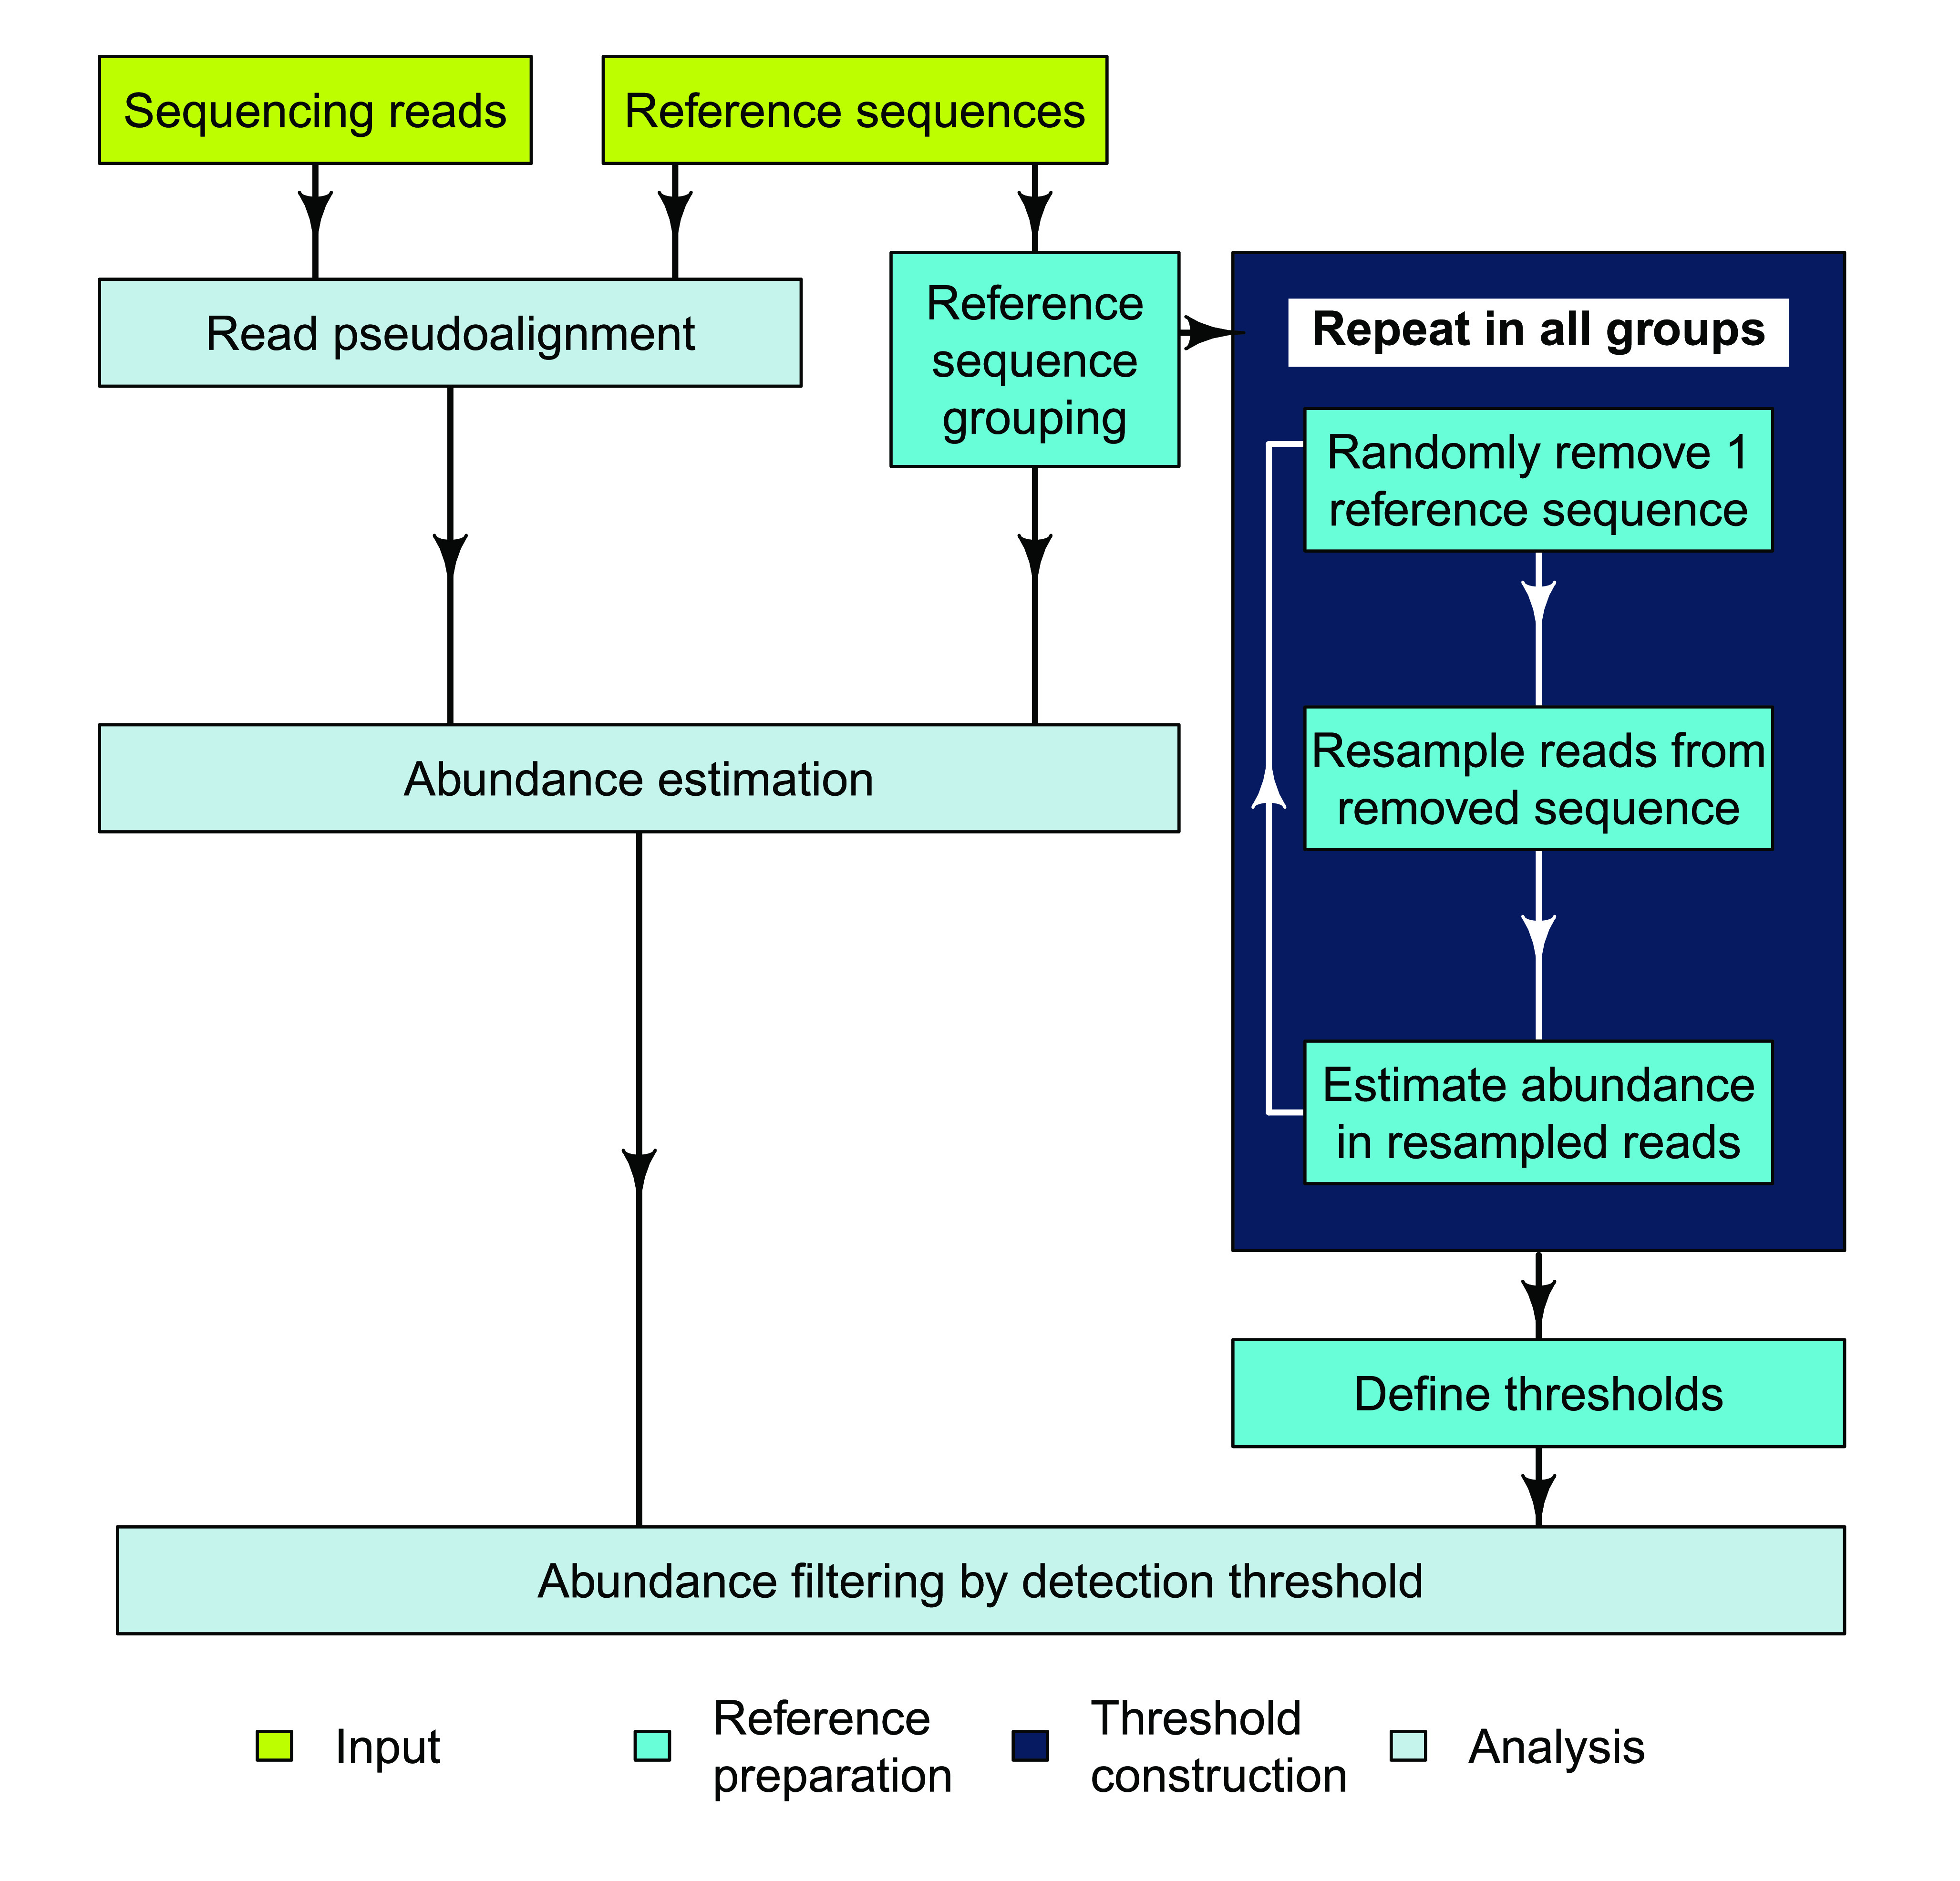
Figure 1. Flowchart of the mSWEEP pipeline describing a typical workflow for relative abundance estimation.

The input part refers to the input data, reference preparation to the operations that need to be performed once per set of reference sequences, and analysis contains the steps run for every sample.
