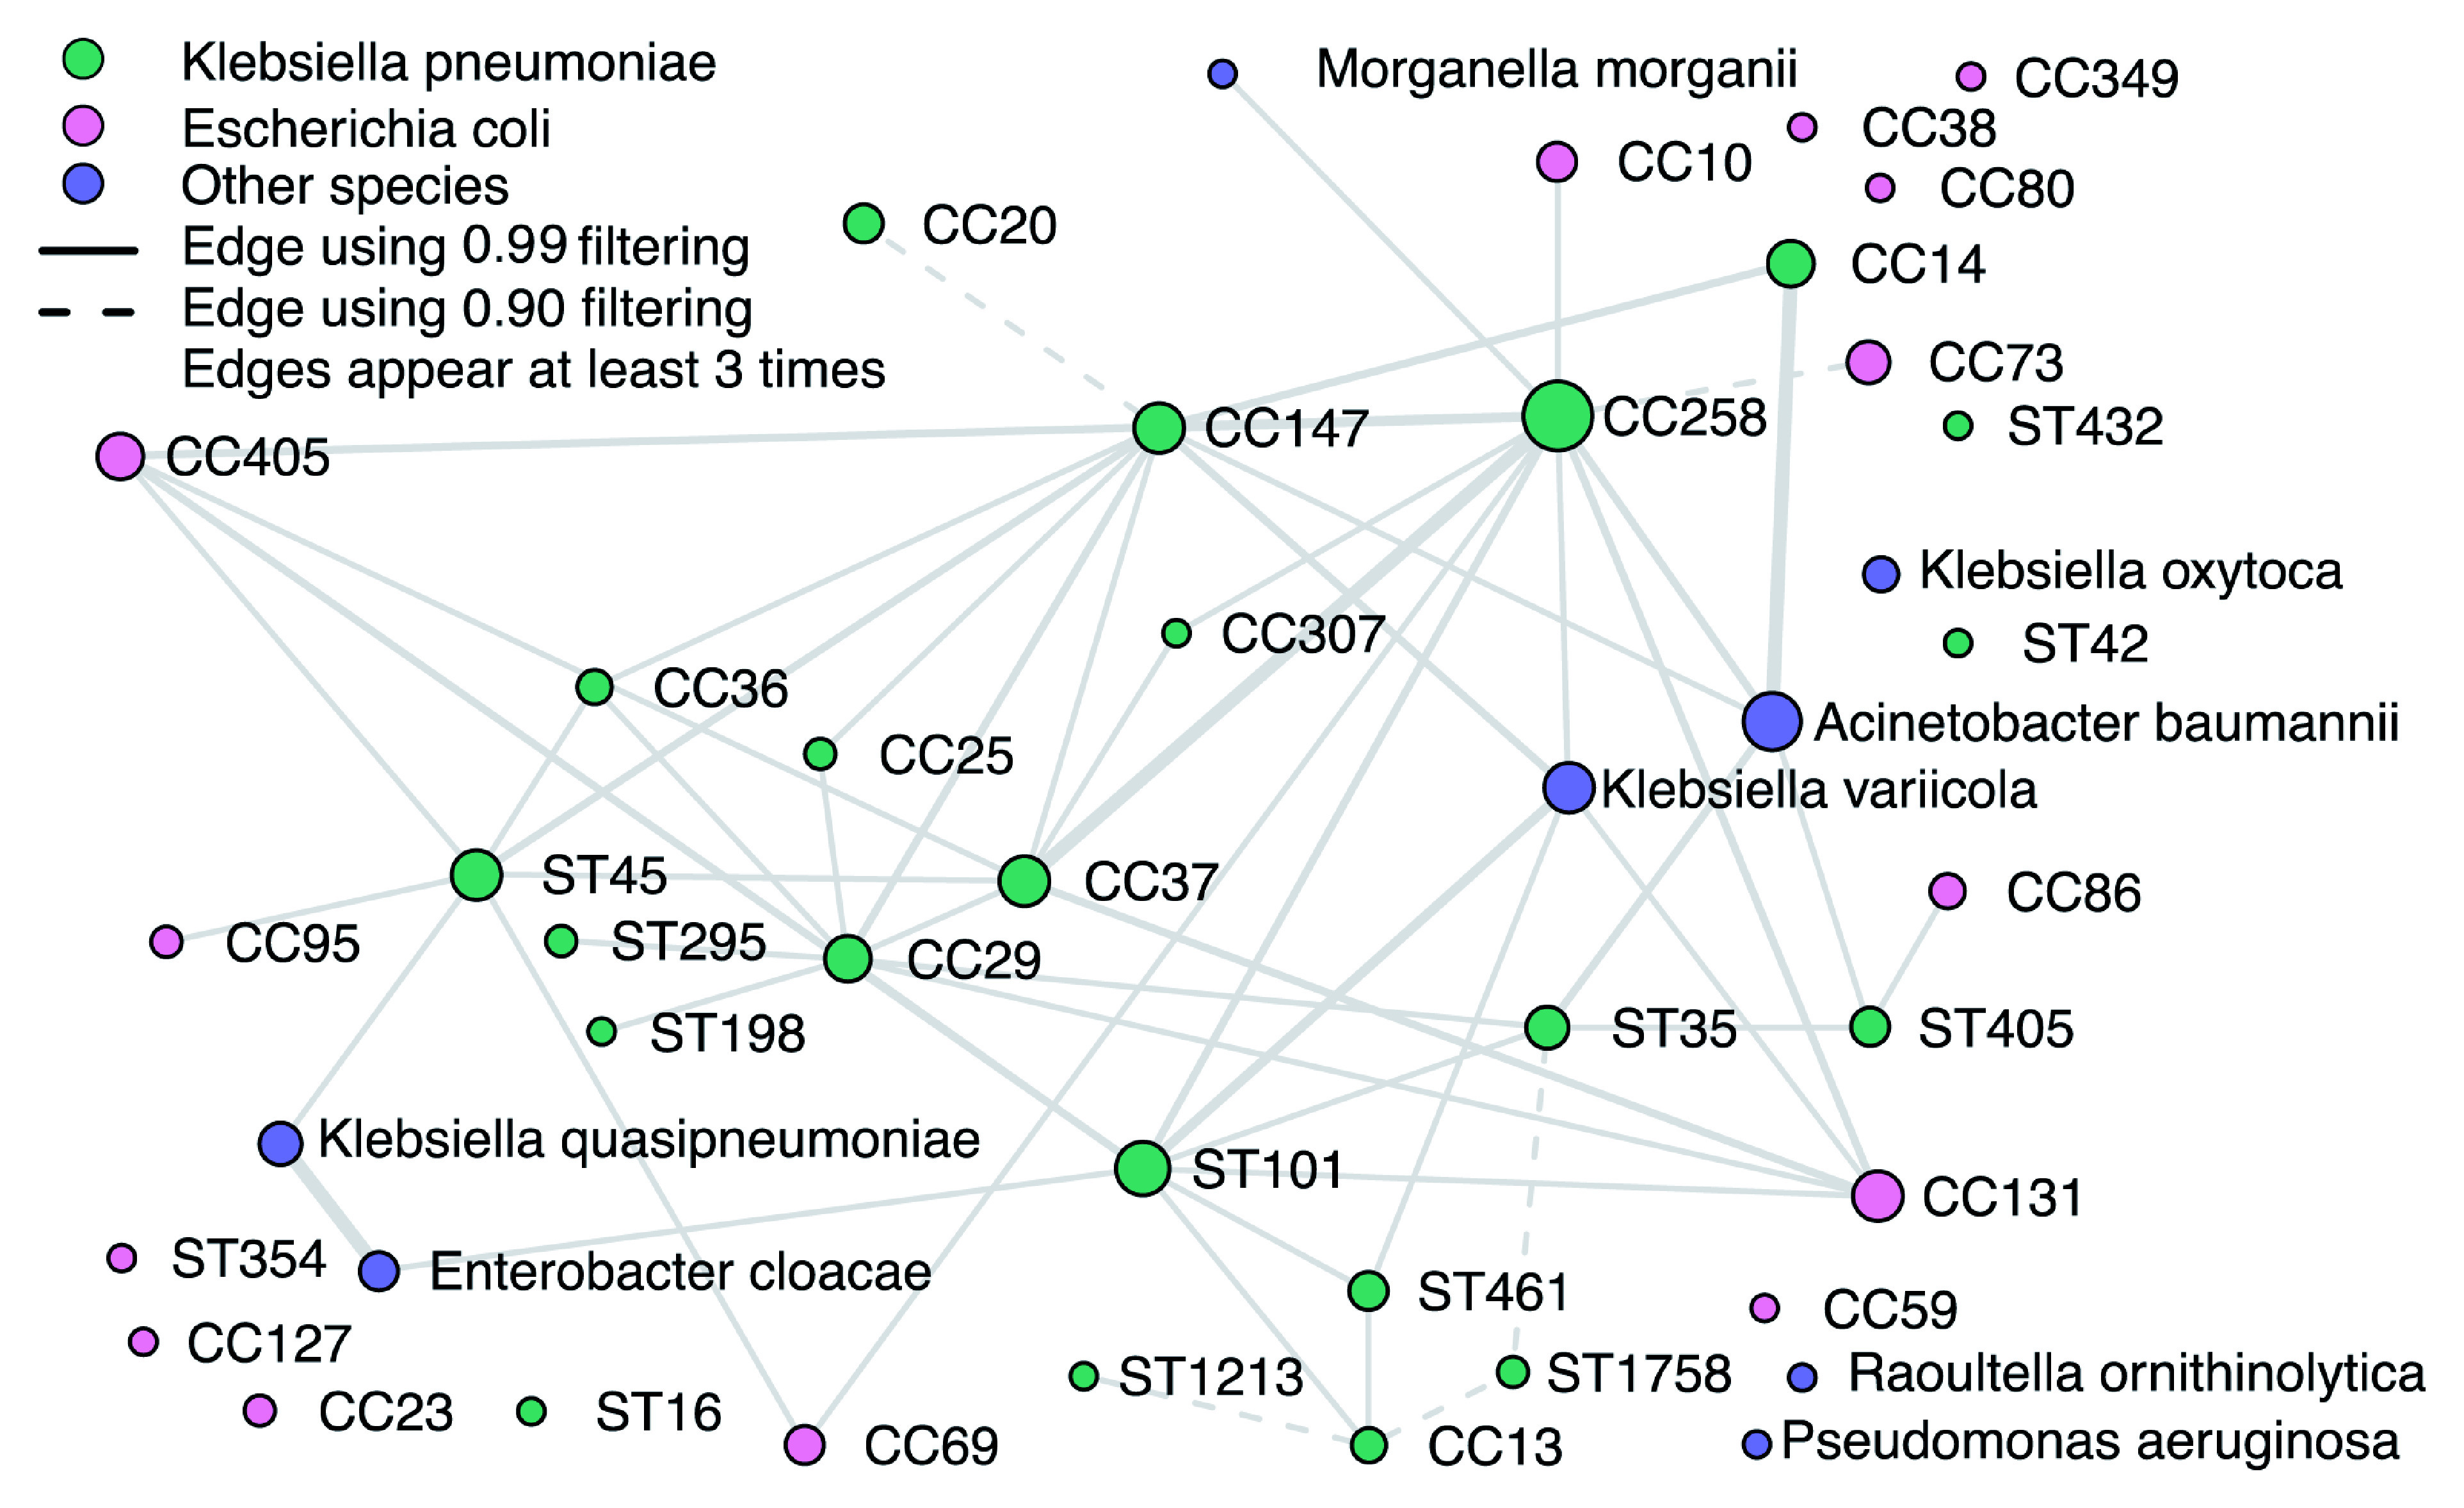
Figure 7. K. pneumoniae lineage coexistence in 179 mixture samples.

The coexistence network was constructed from relative abundance estimates remaining after filtering by the detection thresholds. Visible edges denote coexistence in at least three samples. Dashed edges represent coexistence when using detection thresholds corresponding to the 0.90 confidence score, and solid edges using the 0.99 detection threshold. Node sizes are proportional to the number of times the lineage was observed; edge sizes to the number of times coexistence was established.
