Figure 3.

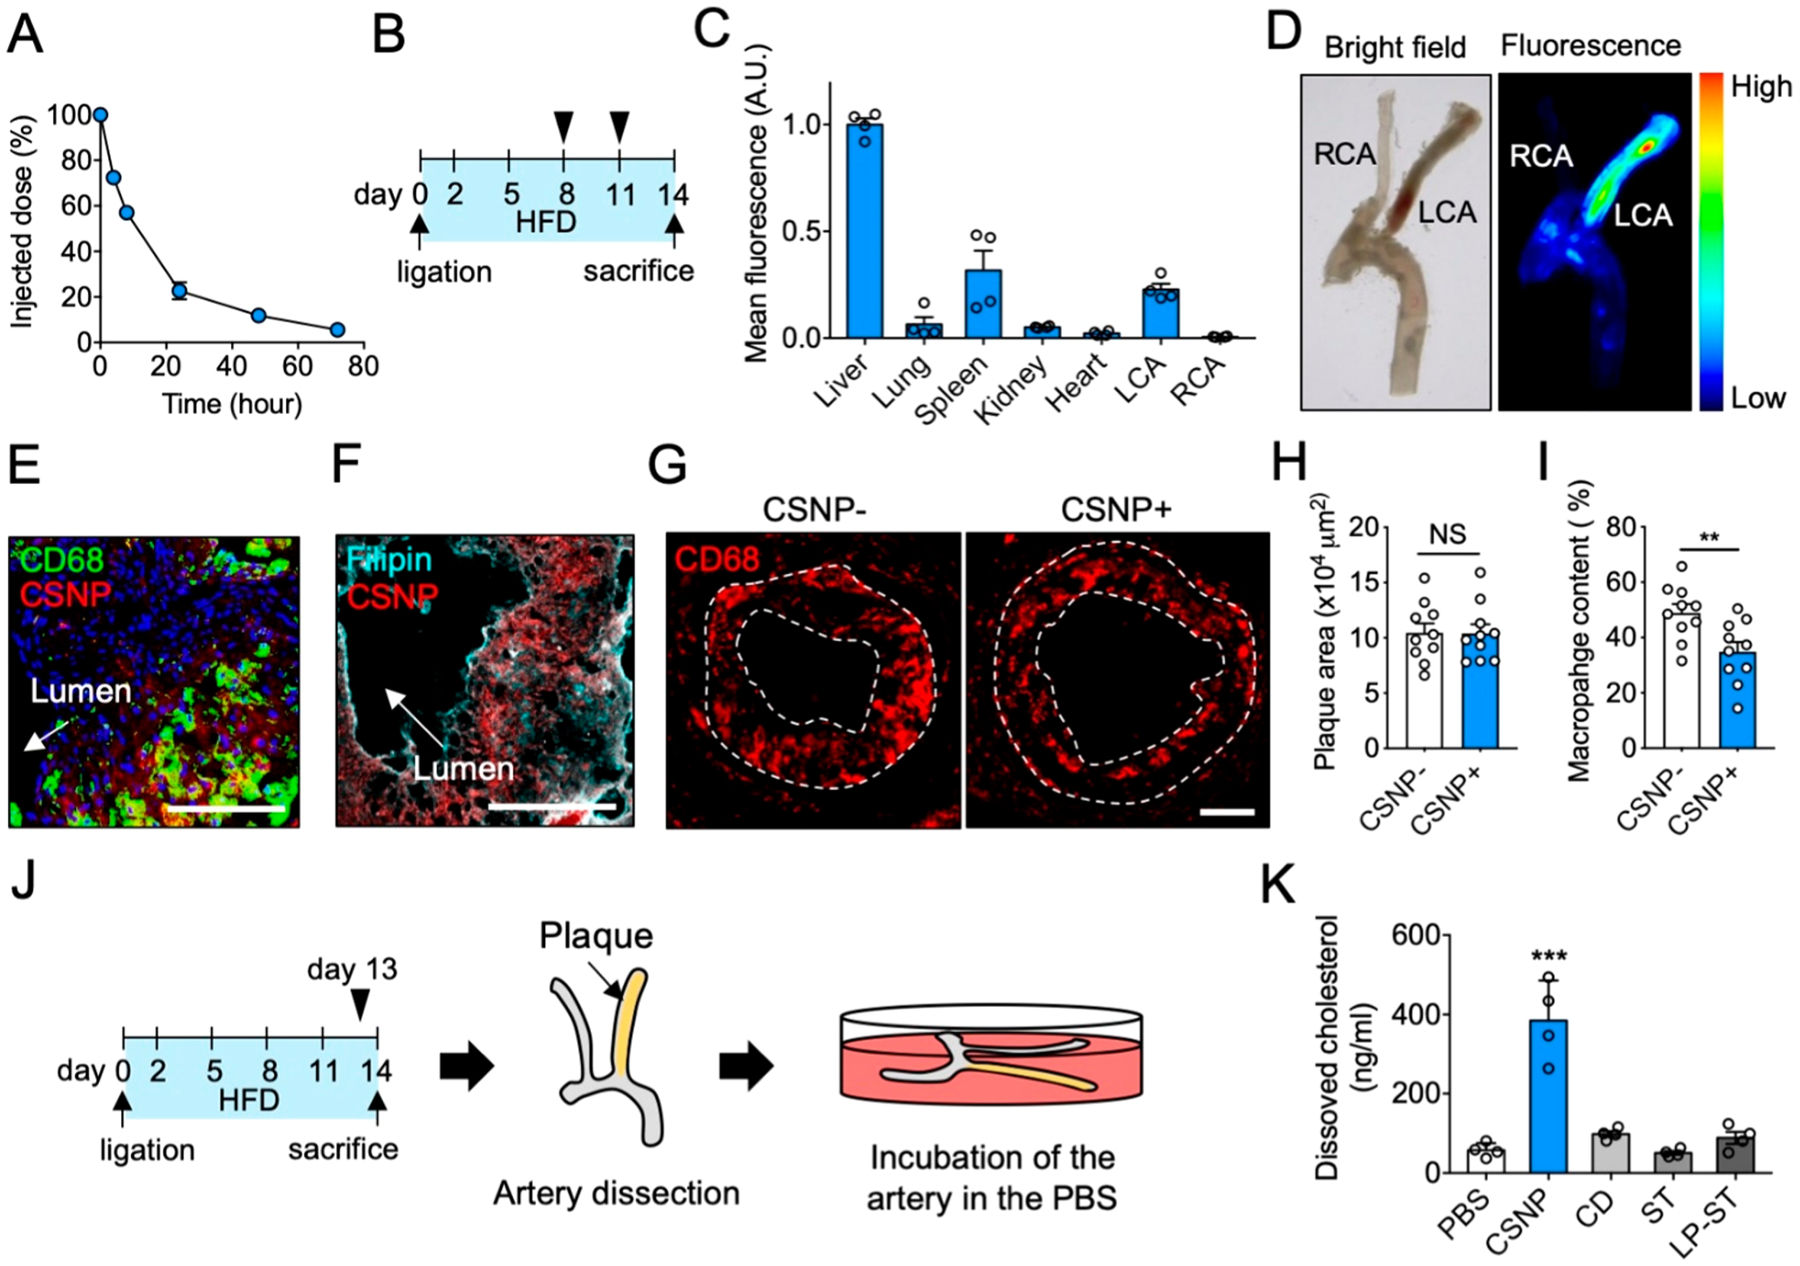
Characterization of CSNP in vivo. (A) Pharmacokinetics of CSNP. (B) Schematic of experimental plan for biodistribution and plaque targeting studies. (C) CSNP accumulation in various organs. (D) Representative ex vivo bright-field and fluorescence images of the dissected carotid artery. (E, F) Representative confocal fluorescence images of the LCA sections after (E) macrophage and (F) cholesterol staining. Anti-CD68 antibody, Filipin, and Hoechst were used to stain macrophage, cholesterol, and nucleus, respectively. The scale bar indicates 100 μm. (G) Representative fluorescence images of the LCA sections showing macrophage content and distribution in plaques. The dotted lines indicate plaque area. (H, I) Quantification of (H) plaque area and (I) macrophage content in panel G. (J) Schematic of experimental plan for ex vivo cholesterol dissolution assay. (K) Quantification of dissolved cholesterol in the PBS. CSNP+ and CSNP− indicate intravenous injection of CSNP and PBS, respectively. Data are mean ± s.e.m. [n = 5 for A; n = 4 for C, H, and I; n = 10 for K; NS, not significant; **P < 0.01, ***P < 0.001, unpaired two-tailed Student’s t test, compared to CSNP− for H and I, and PBS for K].
