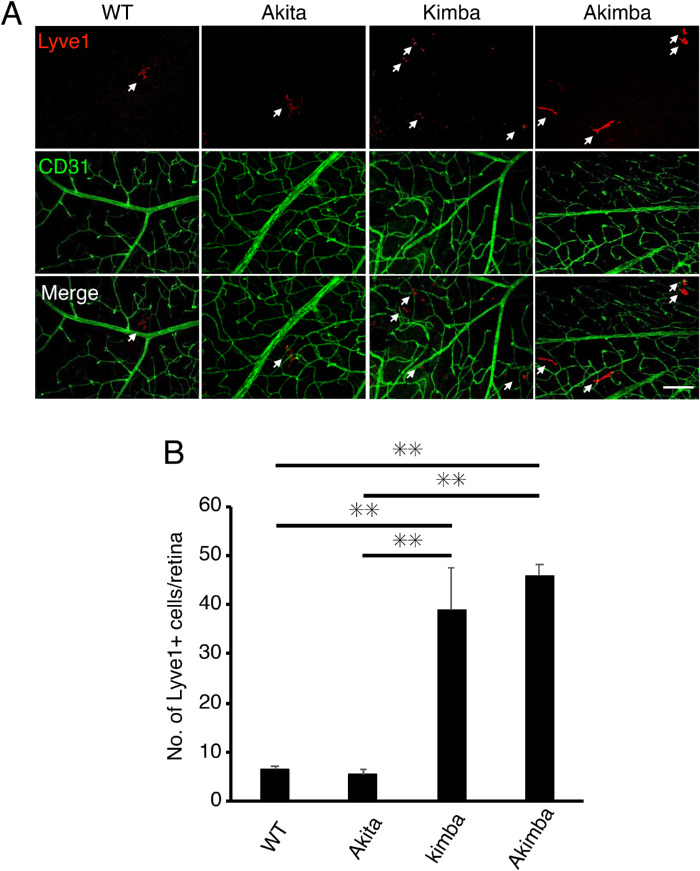
Figure 2.
Lyve1 expression in mouse models of diabetic retinopathy. (A) Representative images of flat-mounted retinas from WT, Akita (Ins2Akita), Kimba (vegfa+/+), and Akimba (Ins2Akita vegfa+/−) mice (7- to 8-week-old) with staining for Lyve1 (red) and CD31 (green). White arrows indicate intraretinal Lyve1-positive cells. Scale bar: 50 µm. (B) Quantitation of the number of Lyve1-positive cells per whole retina from WT, Akita, Kimba, and Akimba mice (n = 8). Values are the means ± SD. **P < 0.01, Student's t-test. (C) A representative image of flat-mounted retinas from Kimba mice with staining for CD31 (green) shows areas that were quantified in Figure 2D (white squares). (D) Representative images in the center, middle, and periphery of flat-mounted retinas from WT, Akita, Kimba, and Akimba mice with staining for CD31 (green) and F4/80 (red). Scale bar: 50 µm. (E) Quantitation of the number of Lyve1-positive cells per indicated area of WT, Akita, Kimba, and Akimba mice (n = 12). Values are the means ± SD. *P < 0.05, **P < 0.005, Student's t-test.

