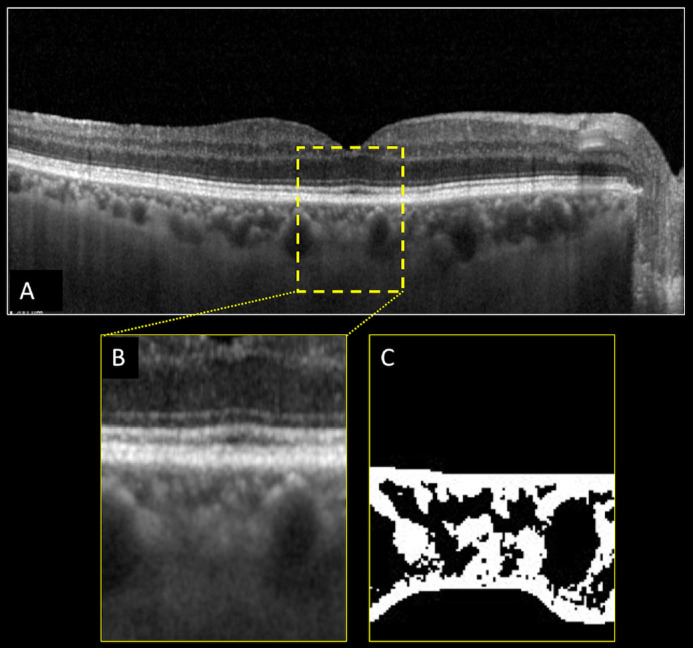
Figure 1.

Structural optical coherence tomography (OCT) and choroidal vascularity index (CVI) calculation of the right eye of a healthy subject (control). Horizontal b-scan structural OCT passing through the fovea (A). A region of interest (ROI) of 1000 µm centered to the fovea was selected (B) and binarized (C) using Niblack's auto-local threshold in order to calculate the CVI. Dark pixels represent the luminal area, whereas white pixels the stromal area. CVI was calculated as the ratio between the luminal area and the total choroidal area.
