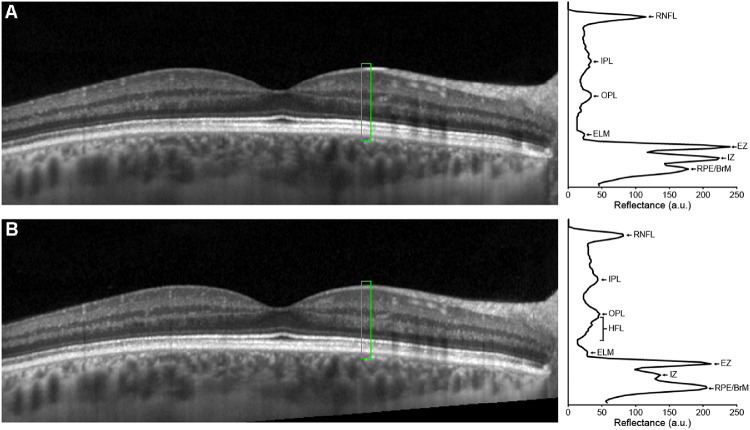
Figure 3.
Horizontal line scan through the foveal center of the right eye of a 30-year-old female with normal vision acquired on a Spectralis OCT device collected with (A) the OCT beam entering the pupil centrally and (B) the OCT entrance beam displaced temporally (in follow-up mode). A horizontal line scan through the fovea was collected in EDI mode using the Spectralis ART feature to produce a final image with 100 frames averaged together. The follow-up scan is automatically aligned to the baseline image with the onboard Spectralis software—though the difference in pupil entry between scans can be detected by inspecting the angled cropping of the follow-up image (bottom right corner of panel B). To the right of each OCT scan is the longitudinal reflectivity profile (LRP) from the region highlighted in green (11 pixels wide). LRPs were generated with OCT Reflectivity Analytics (ORA) software.130 In both panels, the retinal nerve fiber layer (RNFL), inner plexiform layer (IPL), outer plexiform layer (OPL), external limiting membrane (ELM), EZ, interdigitation zone (IZ), and retinal pigment epithelium (RPE)/Bruch's membrane (BrM) are labeled. In panel B, the Henle fiber layer (HFL) is also labeled due to the increased reflectivity of the HFL with the eccentric pupil entry. The two LRPs demonstrate how layer reflectivity can vary due to pupil entry position, which could be misinterpreted as a change in retinal structure. Such variation is especially problematic for longitudinal studies that utilize automated alignment tools.

