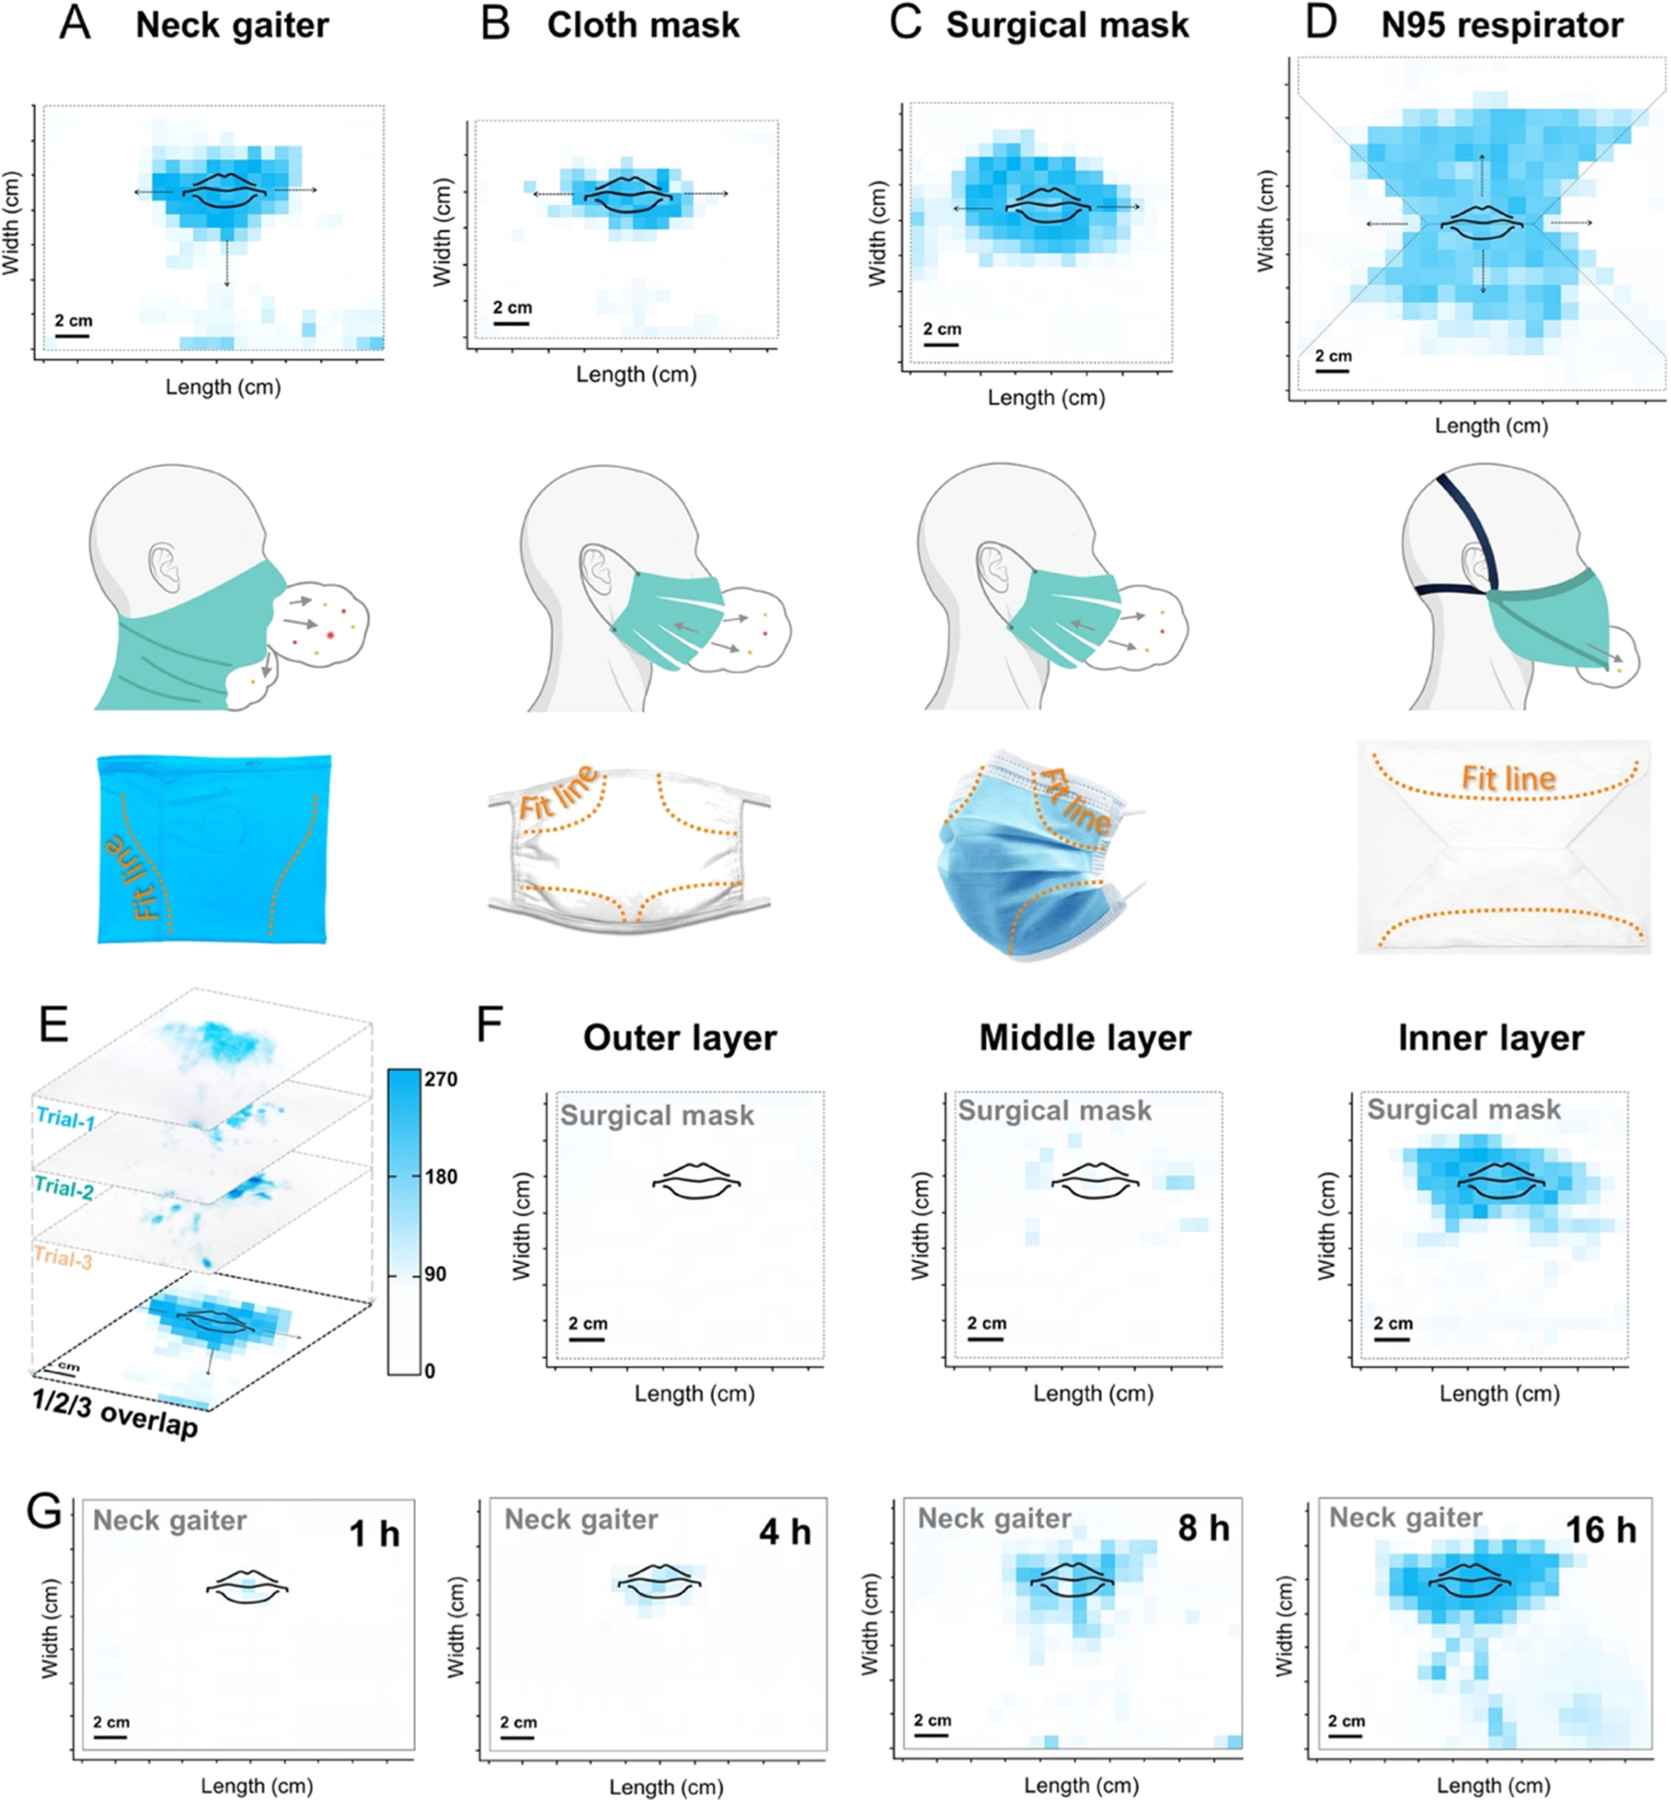
Figure 4.

Distribution of saliva droplets on face coverings. The blue pixels on the map indicate the presence of α-amylase. (A–D) Top panel: amylase distribution on flattened face coverings with a mouth-print. Middle panel: a turbulent jet of respiratory flow. Bottom panel: mask fit to face curvature. Neck gaiter (A) guided the airborne droplets to spread sideways and downward. (E) Each overlayed map counted for three replicates (n = 3, by the same participant). Masks were worn for 8 h, and the inner layer was tested unless otherwise specified. The scale bar designates the color intensity in I/cm2. (F) Tri-layer surgical mask shows that the inner layer contained significant amylase, while middle and outer fabrics had little to none. (G) Longer time of wear increased the amylase concentration and area on neck gaiters.
