FIGURE 4.

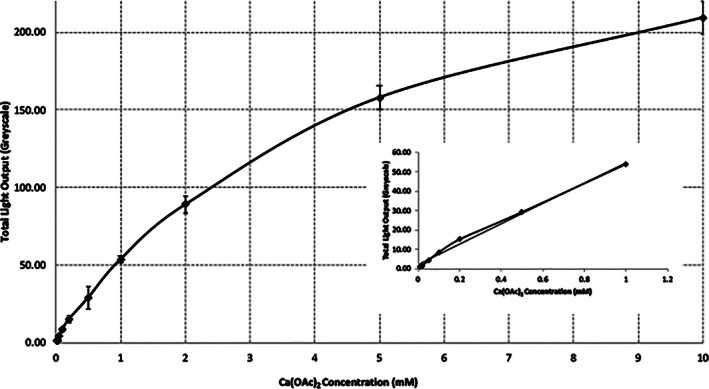
The relationship between concentration of calcium and light output as determined using different concentrations of dried Ca(OAc)2 (calcium acetate) spots

The relationship between concentration of calcium and light output as determined using different concentrations of dried Ca(OAc)2 (calcium acetate) spots