
FIGURE 5.
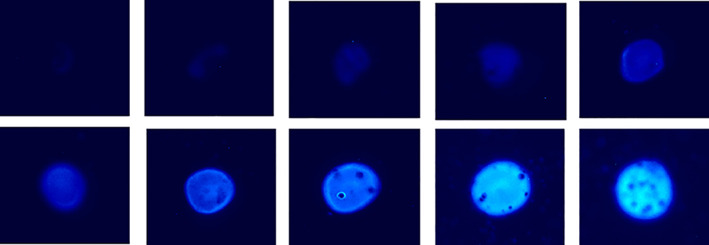
Light captured from CSP‐a added to increasing concentrations of Ca(OAc)2 spots (0.01, 0.02, 0.05, 0.1, 0.2, 0.5, 1, 2, 5 and 10 mM from top left to bottom right). Images have been false colored and show the summed total light of five consecutive 60 s exposures