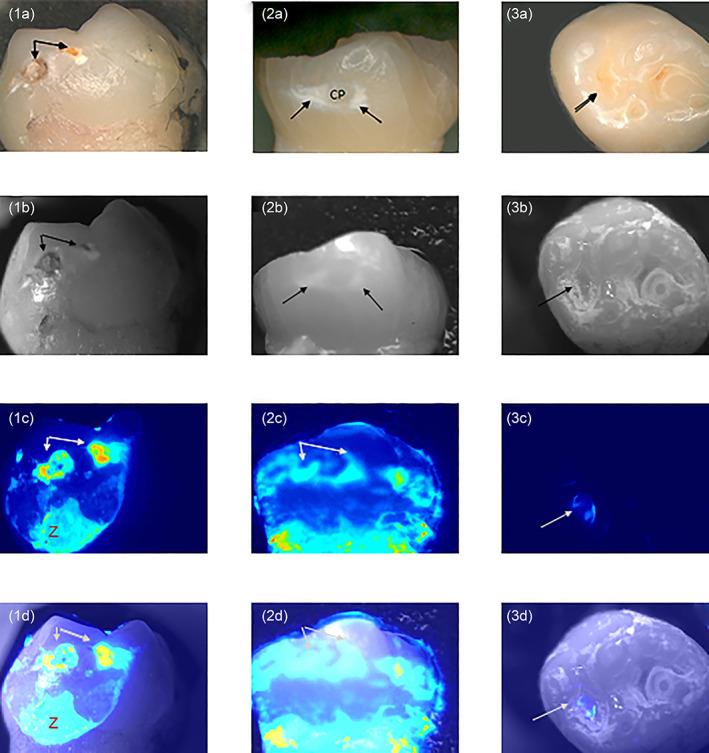
FIGURE 10.

Color light images row “a,” black and white light images row “b,” luminescent images row “c” and merged “b” and “c” images row “d.” Luminescence images show regions of Ca2+ cations on the tooth surface and the merged images show the position of the luminescence on the tooth surface. In 1c and d “Z” indicates an area of tissue that has remained on the tooth after extraction and is producing a bright light signal. In 2a–d “CP” represents the contact point—the area that would have been in contact with the adjacent tooth when in vivo
