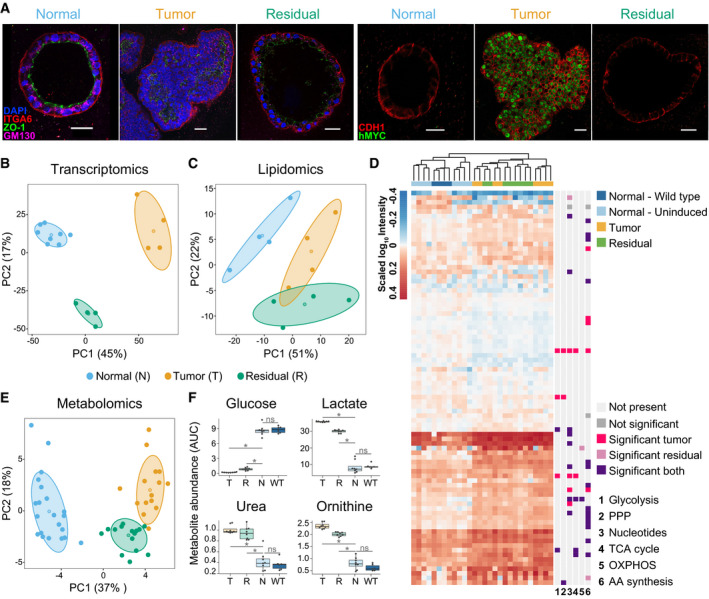
Figure 1. A multi‐omics approach reveals characteristic features of residual organoids in vitro and their metabolic resemblance to tumor organoids.

-
ARepresentative immunofluorescence staining of normal, tumor, and residual 3D organoids grown from primary mammary cells of a preclinical mouse model of breast cancer (Materials and Methods). Similar morphology of normal and residual organoids shown on the left with polarity markers ITGA6 (red), ZO‐1 (green), GM‐130 (magenta); DAPI (blue). Right: human MYC oncoprotein (green) is expressed only in tumor cells, CDH1 (red). Scale bar: 25 μm.
-
B, CPrincipal component (PC) analyses of normal (blue), tumor (orange), and residual (green) cells based on (B) RNA sequencing data (normal, n = 8; tumor and residual, n = 4 each) and (C) lipidomic data (n = 4).
-
DHeat map of untargeted metabolomics results showing the clustering of the normal—wild‐type (dark blue), normal—uninduced (light blue), tumor (yellow), and residual (green) populations and the most altered metabolic pathways (n = 4). Hierarchical clustering was based on the complete linkage method using the Euclidean distance metric. Significance is defined as a false discovery rate < 0.05 vs the normal population, calculated using unpaired two‐sided t‐tests and adjusted for multiple hypothesis testing according to Storey's and Tibshirani's method (Storey & Tibshirani, 2003) (Materials and Methods). PPP, pentose phosphate pathway; TCA, tricarboxylic acid cycle; OXPHOS, oxidative phosphorylation; AA, amino acids.
-
EPrincipal component analysis of normal and WT (blue), tumor (orange), and residual (green) populations based on intracellular metabolomics targeted at central carbon metabolism (n = 8 each; WT n = 2).
-
FSelection of the most profoundly altered metabolites in extracellular spent growth medium from normal (normal and WT, n = 4 and n = 2, respectively), tumor (n = 4), and residual (n = 4) populations, based on metabolomics analysis targeted at central carbon metabolites. Values represent metabolite abundance levels as quantified by the area under the curve (AUC) of the marker fragment ions/transitions for each metabolite. Statistics were calculated using the limma package in R (Ritchie et al, 2015). Significant results (marked with *) correspond to a Benjamini–Hochberg‐adjusted P‐value ≤ 0.05 (residual or tumor compared to normal). ns, not significant. Box plots: midline, median; box, 25–75th percentile; whisker, minimum to maximum.
Data information: (A–F), Number of replicates corresponds to individual mice used to derive organoids. (B, C, E) Centroids represent the mean, and concentration ellipses represent one standard deviation (level = 0.68) of an estimated t‐distribution based on the first two principal components.
