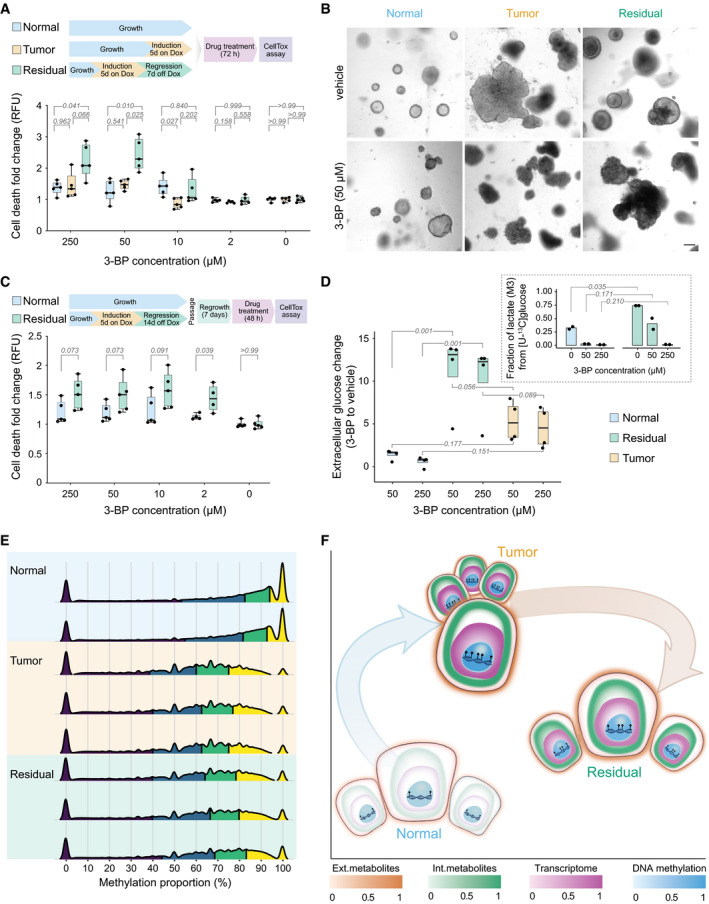
Figure 4. Residual cells require elevated glycolysis for survival and maintain a DNA methylation profile similar to that of tumor cells.

- (Top) Experimental design and (bottom) quantification of cell death (Materials and Methods) of normal, tumor, and residual cells after 72‐h treatment with 3‐BP at the indicated doses (n = 5 mice per condition). Two‐way ANOVA with Tukey's HSD multiple comparison testing was utilized to calculate statistical significance. Dox, doxycycline.
- Representative bright‐field images of normal (left), tumor (middle), and residual (right) organoids, treated with vehicle (top) or with 50 μM 3‐BP (bottom). Scale bar, 100 μm.
- (Top) Experimental design and (bottom) cell death quantification of passaged residual and normal cells after 48 h of treatment with 3‐BP (n = 5 mice per condition). Statistics were calculated with multiple t‐tests.
- (Main) Extracellular glucose abundance changes upon treatment with 3‐BP in all three populations (n = 4 mice per condition). Values represent the ratio of glucose abundance in 3‐BP‐treated vs untreated cells. Statistics were calculated using the limma package (Ritchie et al, 2015) in R with the significance threshold corresponding to a Benjamini–Hochberg‐adjusted P‐value ≤ 0.05 (residual compared to normal). (Insert) Fractional labeling of lactate in untreated and 3‐BP‐treated normal (n = 2) and residual (n = 2) cells following cultivation in growth medium supplemented with [U‐13C] glucose. The three‐carbon labeled (13C) isotopologue (M + 3) of lactate is depicted. Statistics were calculated with unpaired two‐sample t‐tests.
- DNA methylation profiles (measured by bisulfide sequencing) of normal (n = 2 mice), tumor (n = 3 mice), and residual (n = 3 mice) cell structures, showing a striking similarity between residual and tumor cells. Plotted are all quantified CpG sides with more than five reads per condition, randomly down‐sampled to 10,000,000 sides. Colors in the density plots represent quartiles.
- Summary figure integrating transcriptomics (normal, n = 8 mice; tumor and residual, n = 4 mice each), intracellular (Int.) metabolomics (normal, tumor, and residual, n = 8 mice each; WT, n = 2 mice), extracellular (Ext.) metabolomics of spent growth medium (normal, n = 4 mice; WT, n = 2 mice; tumor and residual, n = 3 mice each), and DNA methylomics (normal, n = 2 mice; tumor and residual, n = 3 mice each) from the three populations. Color depth represents the normalized Euclidean distance of the respective omics layer in reference to normal. Distances between the centers of the three populations correspond to the normalized mean Euclidean distances across all represented omics layers.
Data information: (A, C, D) Box plots: midline, median; box, 25–75th percentile; whiskers in (A) and (C) minimum to maximum. Number of replicates corresponds to individual mice used to derive organoids. (A, C, D) Numbers marking comparisons (gray lines) show P‐values (corresponding statistical tests are described in individual panel legends).
