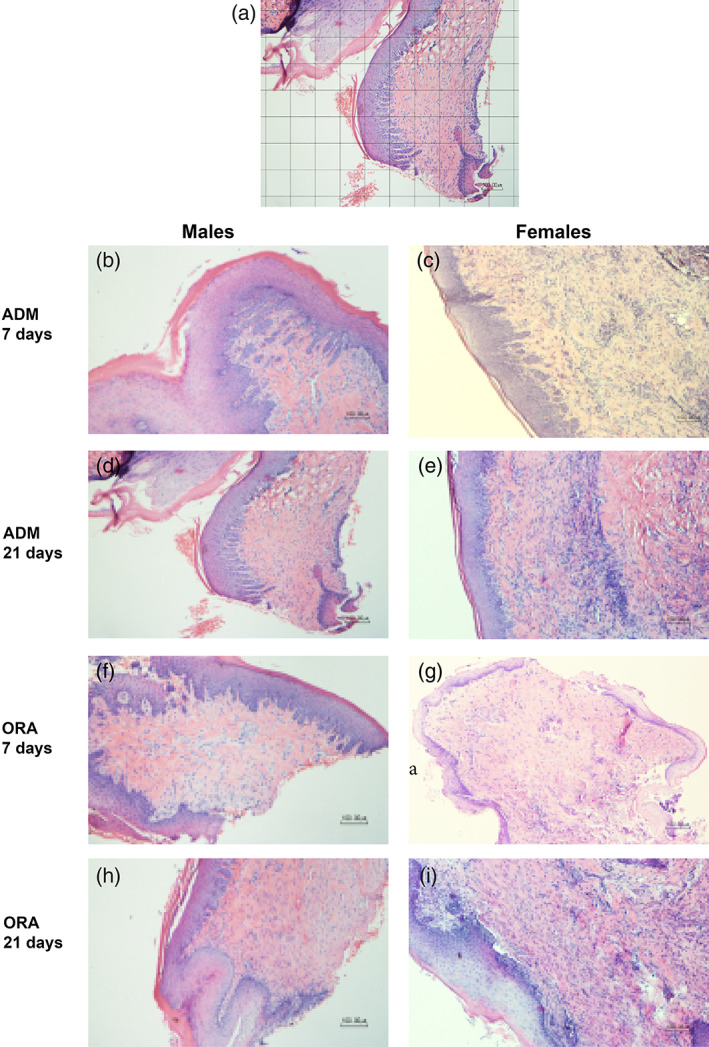
FIGURE 1.

(a) Grid placement for fibroblast quantification; (b–i) Representative slides used for fibroblast quantification for AlloDerm (ADM) and OrACELL (ORA) by gender and timepoint (10× magnification, H&E stain). There was a trend towards a greater number of fibroblasts for OrACELL versus AlloDerm at 7 and 21 days. There were significantly more fibroblasts for the 7‐day males versus the 7‐day females in the OrACELL group (p = .041)
