5.

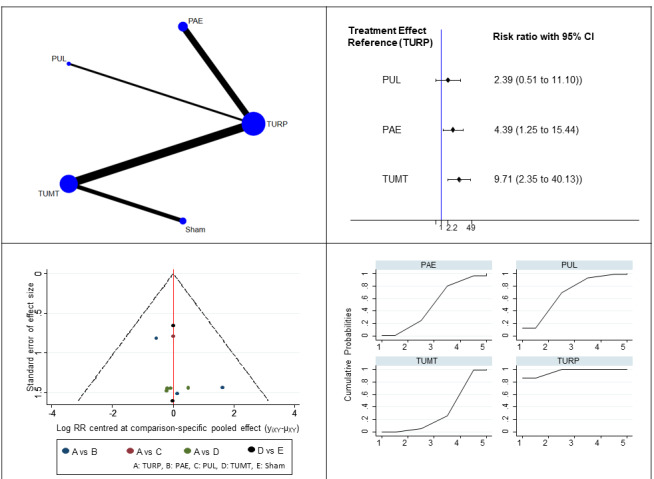
Retreatment. Top left: visual representation of the network. Bottom left: comparison‐adjusted funnel plot for the detection of publication bias. We found no important asymmetry in this plot, therefore publication bias is not strongly suspected. Top right panel: forest plot representing the estimates from the network meta‐analysis, log scale. Bottom right: The surface under the curve (SUCRA) of each of these plots defines the probability that a treatment out of n treatments in a network meta‐analysis is the best, the second, the third, and so on until the least effective treatment. PAE: prostatic arterial embolization; PUL: prostatic urethral lift; TUMT: transurethral microwave thermotherapy; TURP: transurethral resection of the prostate.
