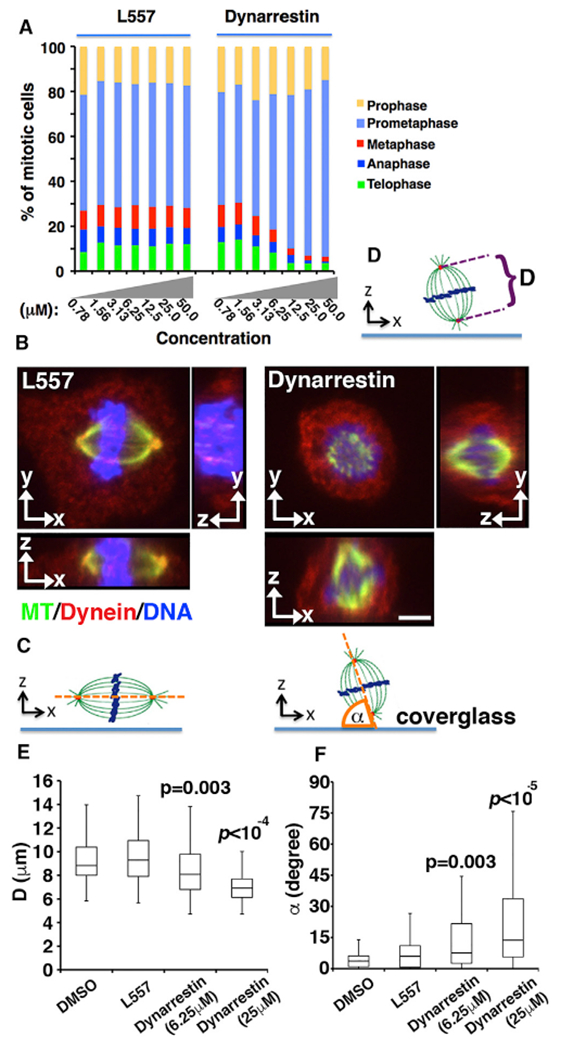
Figure 4. Mitotic Effects of Dynarrestin.

(A) Asynchronous Cos7 populations were treated with dynarrestin for 1 hr at 37°C, then assigned on the basis of chromosome and microtubule configuration (three experiments, n > 600 mitotic cells).
(B–D) Effects on spindle orientation and pole-to-pole distance. (B) Cos7 cells treated as above were stained for MTs (green), dynein (intermediate chain; red) and DAPI (blue). Typical images in x-y, x-z, and y-z planes are shown. Bar, 4 μm. (C and D) Schematics illustrating pole-to-pole distances (“D”) measured from the confocal images (D) and α, the angle between the spindle axis (orange line) and the coverslip (C).
(E) Box-and-whisker plots of pole-to-pole distances as in (D) measured in 50 cells (two independent experiments).
(F) Box-and-whisker plots of spindle orientation (n = 50 cells in two independent experiments).
p Values were calculated using the Mann-Whitney U test. See also Figures S5 and S6.
