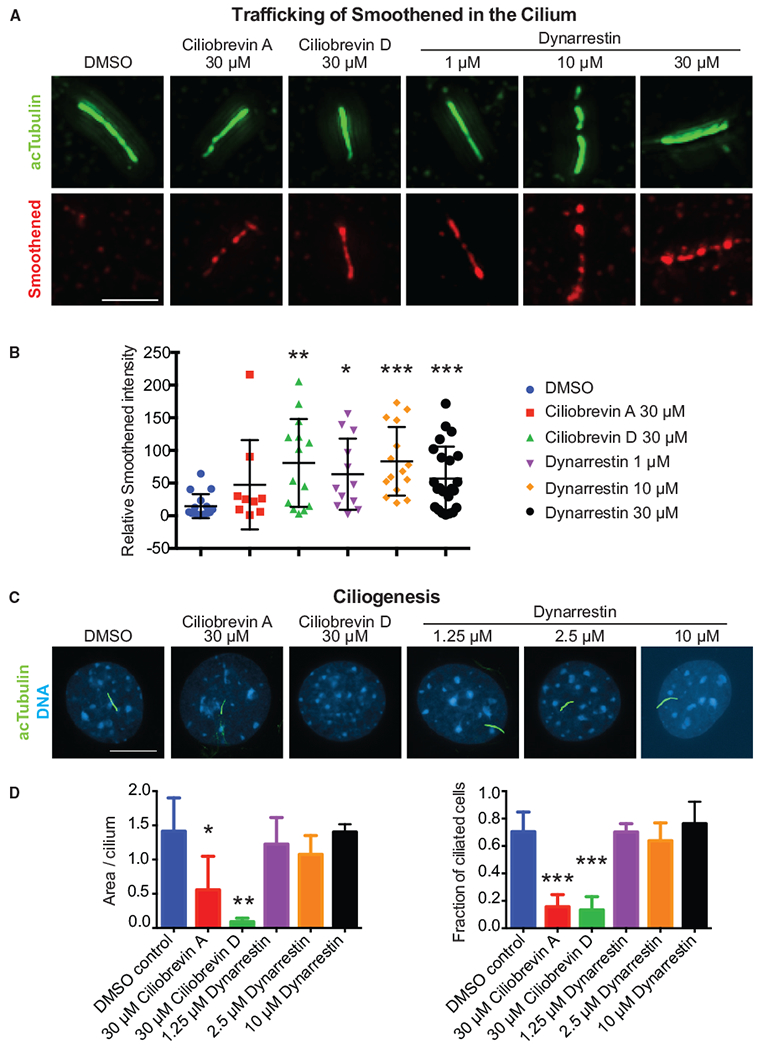
Figure 5. Dynarrestin Inhibits Smoothened Trafficking.

(A) Smoothened and acetylated tubulin (acTubulin) in primary cilia treated for 8 hr with the indicated conditions. Scale bar, 2.4 μm.
(B) Scatter dot plot of Smoothened intensity with bars indicating mean with SD.
(C) Immunostaining for acTubulin of cells induced to form primary cilia under the indicated conditions. Scale bar, 10 μm.
(D) Quantification of ciliogenesis.
Error bars indicate SD. *p < 0.05; **p < 0.01; ***p < 0.001 according to t tests with Welch’s correction.
