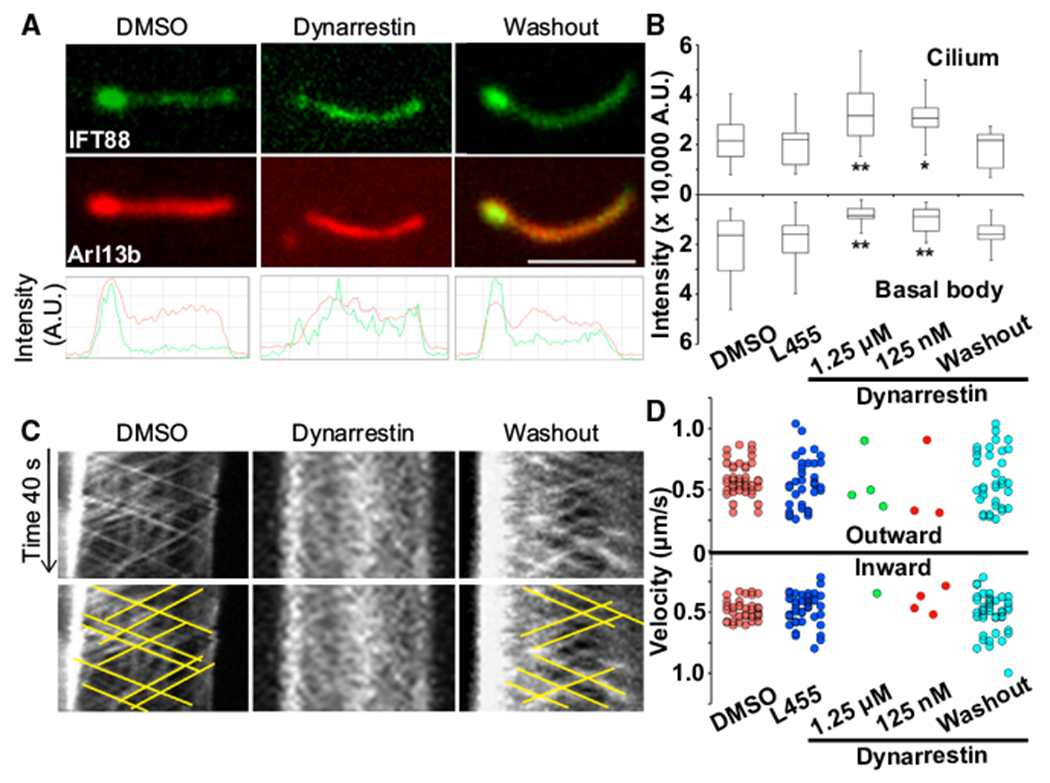
Figure 6. Dynarrestin Inhibits Intraflagellar Transport.

(A) IFT88-GFP (green) and Arl13b-mCherry (red) in primary cilia of serum-starved IMCD3 cells after treatment with 1 % DMSO, 1.25 μM dynarrestin for 1 hr, or 1 hr after dynarrestin washout.
(B) Box-and-whisker plots of the fluorescence intensity of IFT88-GFP in the basal body (lower) and cilia (upper) after 1 hr treatment with 1% DMSO, 1.25 μM L455, 1.25 μM or 125 nM dynarrestin, or after dynarrestin washout (n = 30 cells in two independent experiments). *p < 0.05, **p < 0.01 determined using the Mann-Whitney U test compared with L455 control.
(C) Kymographs illustrating IFT88-GFP particle movements in (A). Yellow lines highlight the moving particles.
(D) Dot plots of IFT88-GFP particle velocities in 600 s observation (60 s/cilium, 10 cilia/condition). Scale bar, 5 μm.
