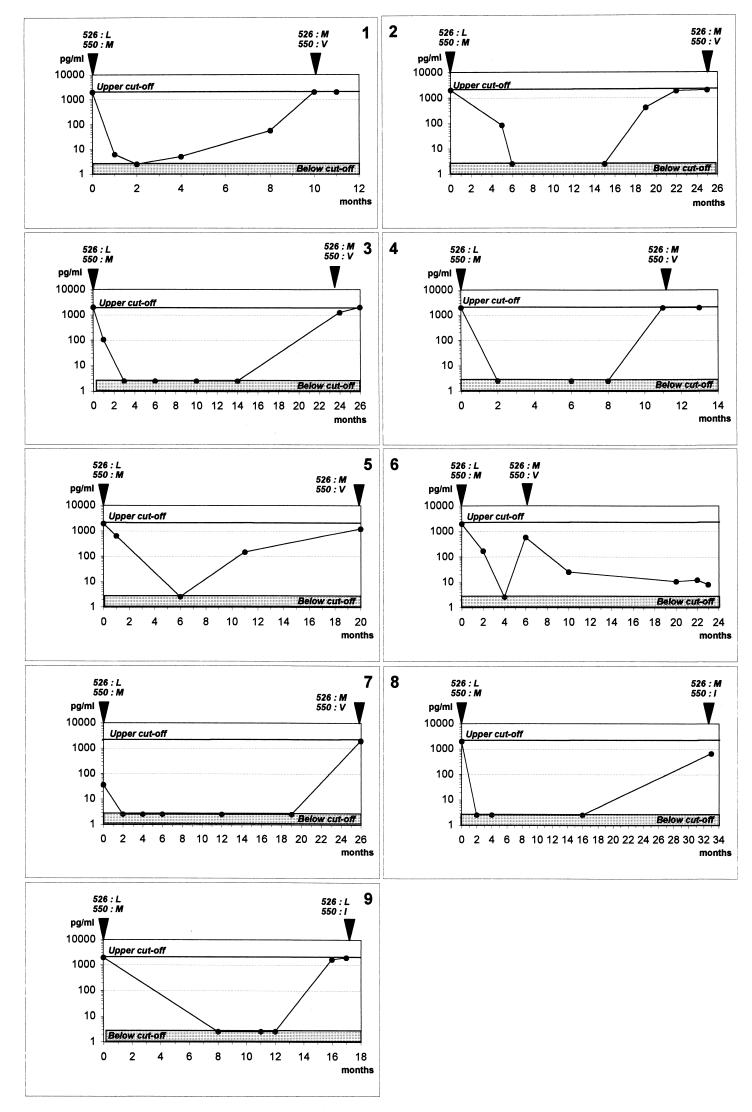
FIG. 1.
Course of HBV DNA during lamivudine treatment and resistance occurrence. HBV DNA from each of nine patients was measured at different time points and is represented by a specific dot. The time point of sequence analysis is represented by an arrowhead above each graph with the position of each residue.

