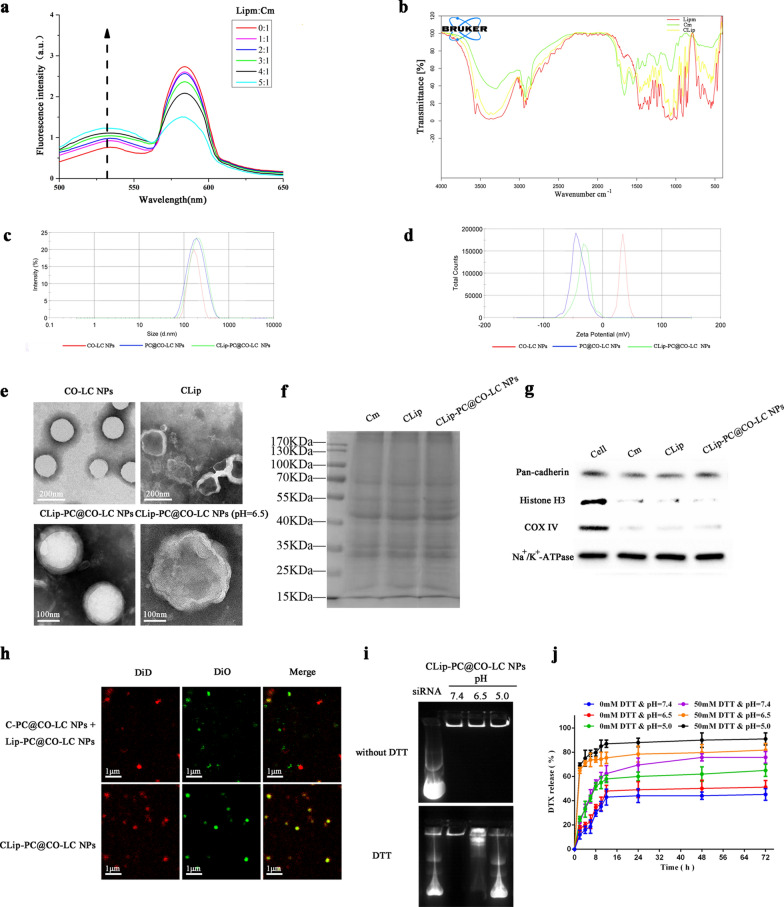
Fig. 1.
Characterization of CLip-PC@CO-LC nanoparticles (NPs). a A549 cell membrane was labeled with DOPE-RhB and C6-NBD as a fluorescence resonance energy transfer (FRET) pair of dyes and fused with an increasing number of liposomes; their fluorescence spectra were then detected and recorded. (Lipm:Cm represents the weight ratio of liposomes to A549 cell membrane proteins). b The Fourier transform infrared (FTIR) spectra of Lipm, Cm, and CLip verified the retention of A549 cell membrane proteins in CLips. c Average hydrodynamic size of CO-LC NPs, PC@CO-LC NPs, and CLip-PC@CO-LC NPs (n = 3). d Zeta potential of CO-LC NPs, PC@CO-LC NPs, and CLip-PC@CO-LC NPs (n = 3). e Representative transmission electron microscopy (TEM) images of CO-LC NPs, CLip, CLip-PC@CO-LC NPs, and CLip-PC@CO-LC NPs (pH = 6.5) negatively stained with phosphotungstic acid (scale bars = 200 nm and 100 nm). f Profiles of proteins in Cm, CLip, and CLip-PC@CO-LC NPs determined using SDS-PAGE. g Western blot analysis of pan-cadherin, histone H3, and COX IV in A549 cells, Cm, CLip, and CLip-PC@CO-LC NPs. h Confocal fluorescent microscopy images of CLip-PC@CO-LC NPs and the mixture of C-PC@CO-LC NPs, Lip-PC@CO-LC NPs (red = Cm, green = liposomes; scale bar = 1 µm). i Electrophoretic gel assays of CLip-PC@CO-LC NPs in the presence or absence of DTT at different pH values (pH = 7.4, 6.0, and 5.0). j DTX release from CLip-PC@CO-LC NPs in the presence or absence of DTT at different pH values (pH = 7.4, 6.5, and 5.0)

